Category: 3DoT Goliath

  • Final Design

    Final Design

    [av_one_full first min_height=” vertical_alignment=” space=” custom_margin=” margin=’0px’ padding=’0px’ border=” border_color=” radius=’0px’ background_color=” src=” background_position=’top left’ background_repeat=’no-repeat’ animation=”]
    [av_textblock size=’25’ font_color=” color=”]
    Goliath Fall 2016
    [/av_textblock]

    [av_hr class=’invisible’ height=’-50′ shadow=’no-shadow’ position=’center’ custom_border=’av-border-thin’ custom_width=’50px’ custom_border_color=” custom_margin_top=’30px’ custom_margin_bottom=’30px’ icon_select=’yes’ custom_icon_color=” icon=’ue808′ font=’entypo-fontello’]

    [av_textblock size=’25’ font_color=” color=”]
    Final Design
    [/av_textblock]
    [/av_one_full]

    [av_hr class=’invisible’ height=’-60′ shadow=’no-shadow’ position=’center’ custom_border=’av-border-thin’ custom_width=’50px’ custom_border_color=” custom_margin_top=’30px’ custom_margin_bottom=’30px’ icon_select=’yes’ custom_icon_color=” icon=’ue808′ font=’entypo-fontello’]

    [av_textblock size=” font_color=’custom’ color=’#bfbfbf’]
    By: Dylan Hong (Design and Manufacturing Engineer)

    Approved by Kristen Oduca (Project Manager)
    [/av_textblock]

    [av_three_fourth first min_height=” vertical_alignment=” space=” custom_margin=” margin=’0px’ padding=’0px’ border=” border_color=” radius=’0px’ background_color=” src=” background_position=’top left’ background_repeat=’no-repeat’ animation=”]
    [av_textblock size=’16’ font_color=’custom’ color=’#6b6b6b’]

    [/av_textblock]
    [/av_three_fourth]

    [av_one_full first min_height=” vertical_alignment=” space=” custom_margin=” margin=’0px’ padding=’0px’ border=” border_color=” radius=’0px’ background_color=” src=” background_position=’top left’ background_repeat=’no-repeat’ animation=”]

    [av_heading tag=’h2′ padding=’10’ heading=’Introuction’ color=’custom-color-heading’ style=” custom_font=’#ff6a00′ size=” subheading_active=” subheading_size=’15’ custom_class=”][/av_heading]

    [av_textblock size=” font_color=” color=”]
    Requirement: 

    • The Goliath shall be a scale model of the Goliath 302 tank. 
      •  The Goliath should have an approximate ratio of 1 : 0.566 : 0.373.
        • Goliath shall house the 3Dot Board, sensors, and custom PCB.
        • The Goliath will have a total of two gears in the front, two driving wheels in the rear side, and fourteen wheels in the center.

    After going through many iterations of the design process to meet functionality and the requirements, we were able to finalize the design of the Goliath. Most of the changes that were made were considered to be tweaks but were necessary to achieve functionality of the tracks, sensors and appearance of the Goliath.
    [/av_textblock]

    [av_heading tag=’h2′ padding=’10’ heading=’Final Body Dimensions’ color=’custom-color-heading’ style=” custom_font=’#ff6a00′ size=” subheading_active=” subheading_size=’15’ custom_class=”][/av_heading]

    [av_textblock size=” font_color=” color=”]
    After many iterations of redesigning the chassis dimensions, we were able find the right dimensions to fit all the necessary components while making it functional. The final dimensions were measured at 4.71 x 3.77 x 1.8 inches. When compared to the previous dimension of 4.27 x 2.94 x1.5 inches, the final dimensions were increased by 0.44 x 0.83 x 0.3 inches. This increase was necessary because we decided to use the prefabricated Tamiya tracks, which were larger in width than the side panel that I designed previously. Also, the sensors needed clearance for it to be hinged on the side panel. Furthermore, the height was slightly increased because of the redesign of the wheels. The length is much higher than the previous design because we included the bar attachment on the rear side; without the bar the dimensions would be at 4.3 inches. Also, the length was slightly increased (without bar attachment) to seat the 3Dot Board on a flat surfaces instead of on an angled incline, as seen in the Post PDR Redesign blog post.
    [/av_textblock]

    [av_hr class=’invisible’ height=’20’ shadow=’no-shadow’ position=’center’ custom_border=’av-border-thin’ custom_width=’50px’ custom_border_color=” custom_margin_top=’30px’ custom_margin_bottom=’30px’ icon_select=’yes’ custom_icon_color=” icon=’ue808′ font=’entypo-fontello’]

    [av_textblock size=” font_color=” color=”]
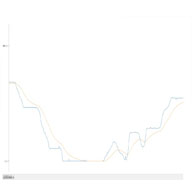
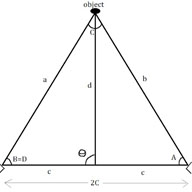
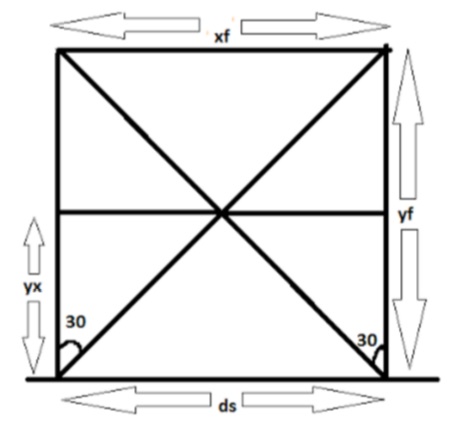
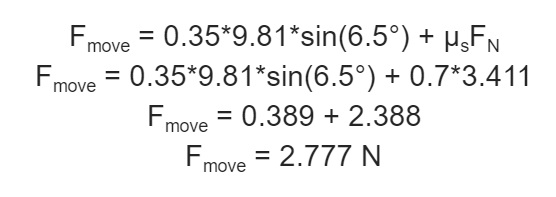
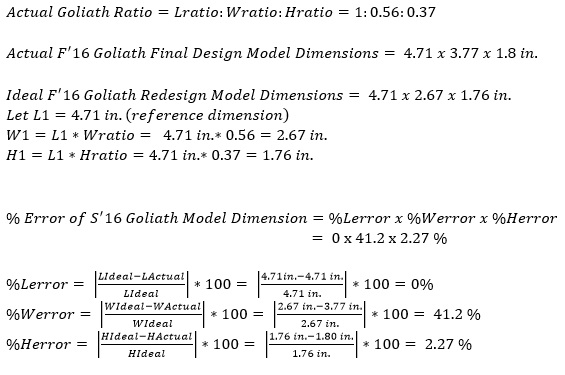
    In the calculations shown in Figure 1, when comparing the actual final dimensions versus the ideal final dimensions, we can observe that the actual dimensions did not meet the exact proportions of the real 302 Goliath.
    [/av_textblock]

    [av_hr class=’invisible’ height=’20’ shadow=’no-shadow’ position=’center’ custom_border=’av-border-thin’ custom_width=’50px’ custom_border_color=” custom_margin_top=’30px’ custom_margin_bottom=’30px’ icon_select=’yes’ custom_icon_color=” icon=’ue808′ font=’entypo-fontello’]

    [av_textblock size=” font_color=” color=”]

    Figure 1 - Calculating Percent Error
    Figure 1 – Calculating Percent Error

    [/av_textblock]

    [av_hr class=’invisible’ height=’20’ shadow=’no-shadow’ position=’center’ custom_border=’av-border-thin’ custom_width=’50px’ custom_border_color=” custom_margin_top=’30px’ custom_margin_bottom=’30px’ icon_select=’yes’ custom_icon_color=” icon=’ue808′ font=’entypo-fontello’]

    [av_textblock size=” font_color=” color=”]
    The width of the Goliath is the only measurement that was vastly skewed by a percent error of 41.2%. And as mentioned in the previous paragraph, the main reason for this disproportionality is because the Tamiya tracks and sensors needed to be incorporated into the design. Even though the requirements state that we should have the dimensions proportionate to the ratio, the customer approved the waiver for the implementation of the sensors.
    [/av_textblock]

    [av_hr class=’invisible’ height=’20’ shadow=’no-shadow’ position=’center’ custom_border=’av-border-thin’ custom_width=’50px’ custom_border_color=” custom_margin_top=’30px’ custom_margin_bottom=’30px’ icon_select=’yes’ custom_icon_color=” icon=’ue808′ font=’entypo-fontello’]

    [av_textblock size=” font_color=” color=”]
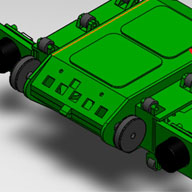
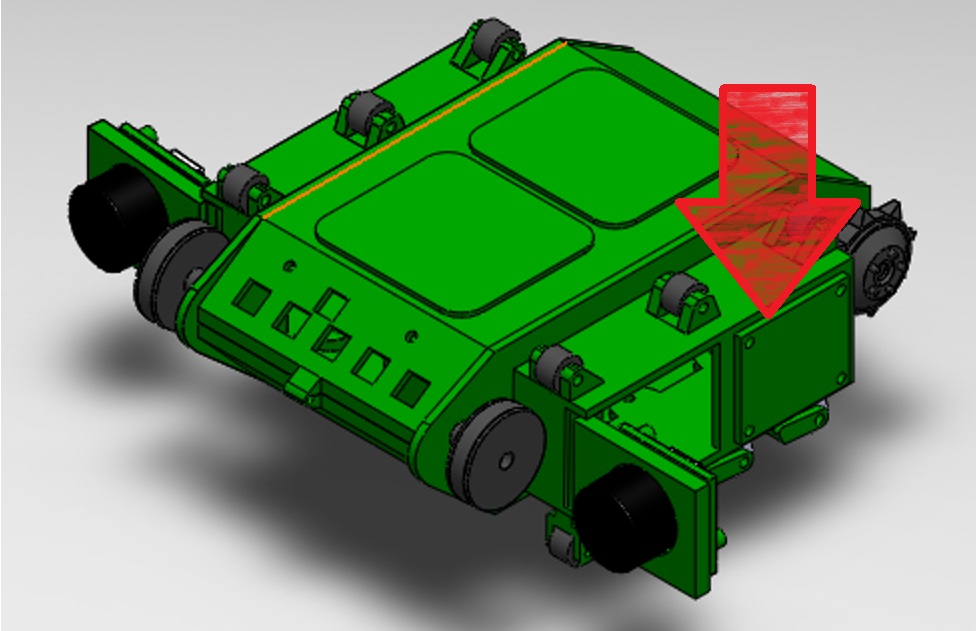
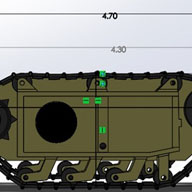
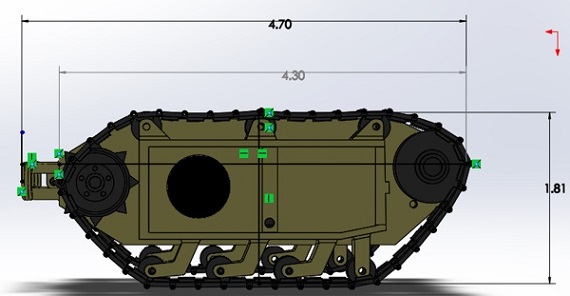
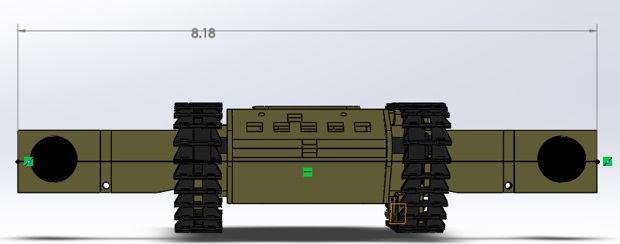
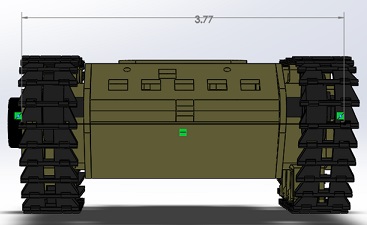
    The images shown in Figure 2, 3, and 4 represent the actual measurements of the Goliath model provided by Solidworks. The height is measured from the top wheels to the bottom wheels. I included two measurements of length to show the length with and without the bar attachment. The width also has two measurements, one with the sensor doors opened at max and when the doors are closed.
    [/av_textblock]

    [av_hr class=’invisible’ height=’20’ shadow=’no-shadow’ position=’center’ custom_border=’av-border-thin’ custom_width=’50px’ custom_border_color=” custom_margin_top=’30px’ custom_margin_bottom=’30px’ icon_select=’yes’ custom_icon_color=” icon=’ue808′ font=’entypo-fontello’]

    [av_textblock size=” font_color=” color=”]

    Figure 2 - Side View
    Figure 2 – Side View

    [/av_textblock]

    [av_hr class=’invisible’ height=’20’ shadow=’no-shadow’ position=’center’ custom_border=’av-border-thin’ custom_width=’50px’ custom_border_color=” custom_margin_top=’30px’ custom_margin_bottom=’30px’ icon_select=’yes’ custom_icon_color=” icon=’ue808′ font=’entypo-fontello’]

    [av_textblock size=” font_color=” color=”]

    Figure 3 - Front View Doors Open
    Figure 3 – Front View Doors Open

    [/av_textblock]

    [av_hr class=’invisible’ height=’20’ shadow=’no-shadow’ position=’center’ custom_border=’av-border-thin’ custom_width=’50px’ custom_border_color=” custom_margin_top=’30px’ custom_margin_bottom=’30px’ icon_select=’yes’ custom_icon_color=” icon=’ue808′ font=’entypo-fontello’]

    [av_textblock size=” font_color=” color=”]

    Figure 4 - Front View Doors Closed
    Figure 4 – Front View Doors Closed

    [/av_textblock]

    [av_heading tag=’h2′ padding=’10’ heading=’Final Design’ color=’custom-color-heading’ style=” custom_font=’#ff6a00′ size=” subheading_active=” subheading_size=’15’ custom_class=”][/av_heading]

    [av_textblock size=” font_color=” color=”]
    The biggest design change that we incorporated was the hinge movement and sensor doors. After printing the last design for our demonstration, we realized that a snap on hinge was not the best type of hinge for our design because our model is thin and miniature, which made it more likely to break off. Therefore, we determined that substituting the snap on hinges with a rod hinge would provide sturdiness for the hinges on the side parts with side doors, and the top panel with the bottom panel.
    [/av_textblock]

    [av_hr class=’invisible’ height=’20’ shadow=’no-shadow’ position=’center’ custom_border=’av-border-thin’ custom_width=’50px’ custom_border_color=” custom_margin_top=’30px’ custom_margin_bottom=’30px’ icon_select=’yes’ custom_icon_color=” icon=’ue808′ font=’entypo-fontello’]

    [av_textblock size=” font_color=” color=”]
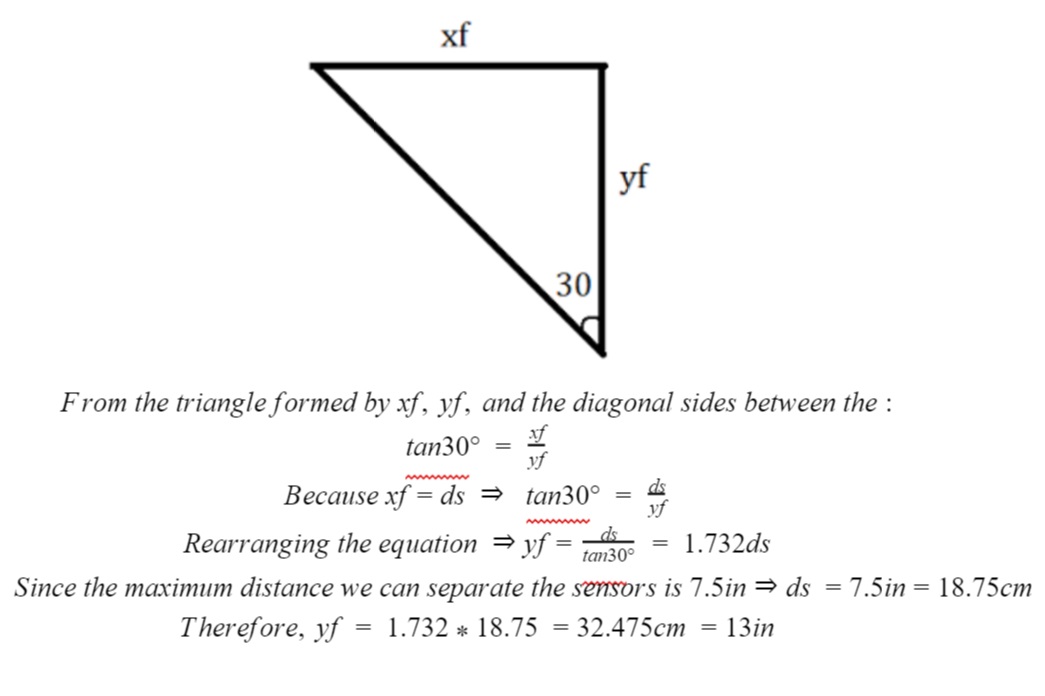
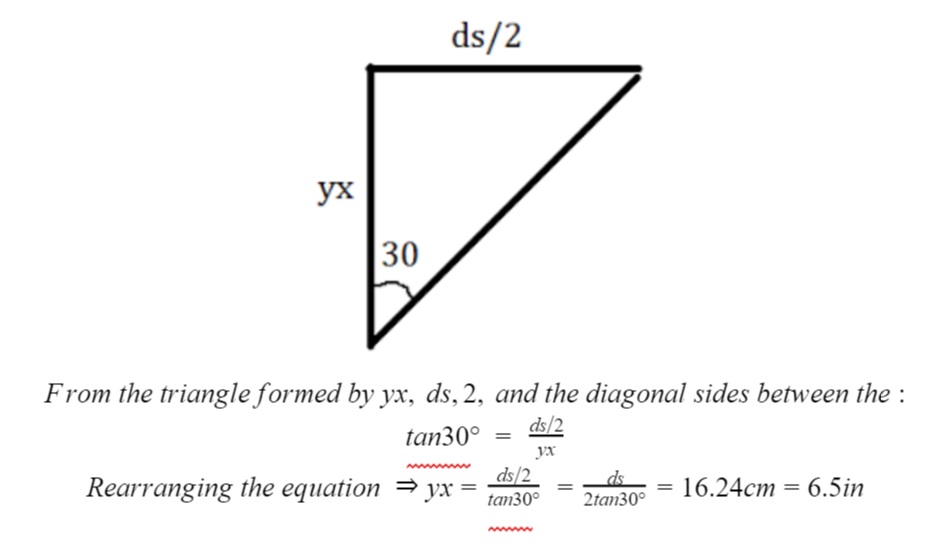
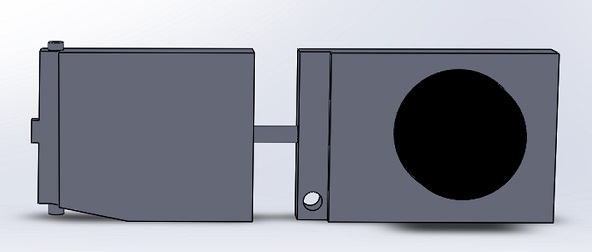
    When testing the previous design with the sensors and control algorithm through the obstacle course, we realized that the sensors were detecting the uneven surfaces and ramps. This issue interfered with the autonomous tracking of Biped and resulted in failing the mission objective. To resolve this issue we declared that the sensors must be angled about 15 degrees upward. Also, we realized that we must extend the sensor door to its maximum length of 2.5 inches. This led to the design change of the whole sensor doors and as the design and manufacturing engineer, I decided to split the doors into two parts and incorporate a rod in the center of each part. The rod will allow the piece holding the sensors to move up and down, while the other part will move side to side. The sensor door is shown in Figure 5.
    [/av_textblock]

    [av_hr class=’invisible’ height=’20’ shadow=’no-shadow’ position=’center’ custom_border=’av-border-thin’ custom_width=’50px’ custom_border_color=” custom_margin_top=’30px’ custom_margin_bottom=’30px’ icon_select=’yes’ custom_icon_color=” icon=’ue808′ font=’entypo-fontello’]

    [av_textblock size=” font_color=” color=”]

    Figure 5 - Sensor Door
    Figure 5 – Sensor Door

    [/av_textblock]

    [av_hr class=’invisible’ height=’20’ shadow=’no-shadow’ position=’center’ custom_border=’av-border-thin’ custom_width=’50px’ custom_border_color=” custom_margin_top=’30px’ custom_margin_bottom=’30px’ icon_select=’yes’ custom_icon_color=” icon=’ue808′ font=’entypo-fontello’]

    [av_textblock size=” font_color=” color=”]
    As for the wheels, we increased the thickness of the wheels from 3.5 to 5.4mm and the diameter of the wheels from 6mm to 7.5mm for the bottom wheels and 8mm for the top wheels. The increase will help the Tamiya tracks fit nicely with the wheels intact and will prevent the bumper of the tracks from hitting the wheel holders. Also, the front bottom wheels were redesigned, instead of being angled like the rest of the bottom wheels, we made it come straight down. The reason for this redesign was because the tracks would grind against the angled area which caused more friction and unnecessary noise.
    [/av_textblock]

    [av_hr class=’invisible’ height=’20’ shadow=’no-shadow’ position=’center’ custom_border=’av-border-thin’ custom_width=’50px’ custom_border_color=” custom_margin_top=’30px’ custom_margin_bottom=’30px’ icon_select=’yes’ custom_icon_color=” icon=’ue808′ font=’entypo-fontello’]

    [av_textblock size=” font_color=” color=”]
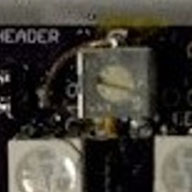
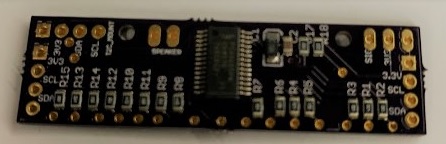
    In practice, the PCB was interfering with the 3mm rod for the larger rotating wheels in the front. This resulted in damaging the wires connected to the PCB and the top and bottom parts could not close. Therefore, we had to shift the PCB cut out up by about 1.5mm to relieve any clearance issues and directly solder on jumper wires instead of male header pins.
    [/av_textblock]

    [av_hr class=’invisible’ height=’20’ shadow=’no-shadow’ position=’center’ custom_border=’av-border-thin’ custom_width=’50px’ custom_border_color=” custom_margin_top=’30px’ custom_margin_bottom=’30px’ icon_select=’yes’ custom_icon_color=” icon=’ue808′ font=’entypo-fontello’]

    [av_textblock size=” font_color=” color=”]
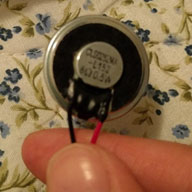
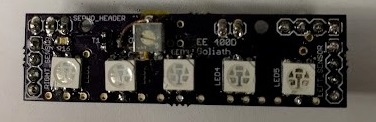
    Originally, we wanted to mount the speaker to the bottom panel but realized that there was not enough room since we changed from an 8ohm 0.25W speaker at 25mm to an 8ohm .5 Watt speaker at 30mm. We decided that the best fit for a speaker mount would be on the top panel. The mount is designed to tightly fit the speaker and includes an opening for the wires of the speaker to be connected to the PCB.
    [/av_textblock]

    [av_hr class=’invisible’ height=’20’ shadow=’no-shadow’ position=’center’ custom_border=’av-border-thin’ custom_width=’50px’ custom_border_color=” custom_margin_top=’30px’ custom_margin_bottom=’30px’ icon_select=’yes’ custom_icon_color=” icon=’ue808′ font=’entypo-fontello’]

    [av_textblock size=” font_color=” color=”]
    For the bottom, we included screw mounts for the 3Dot board and for the side panel, which was recommended by Jeff Gomes. In the previous design, the connection between the side panel and bottom panel was sturdy enough but still had tendencies to wobble from left to right. So the screw mounts attached to the angled part of the bottom panel will add extra security and less movement between the two parts since there will be more than one plane being screwed on to the side panel. As for the 3dot board, there is a Bluetooth module on the bottom of the board, which causes an uneven surface when being mounted onto the bottom panel. The added screw mounts, which are extruded by 2mm will provide a balanced seat when mounting the 3dot to the bottom part.
    [/av_textblock]

    [av_hr class=’invisible’ height=’20’ shadow=’no-shadow’ position=’center’ custom_border=’av-border-thin’ custom_width=’50px’ custom_border_color=” custom_margin_top=’30px’ custom_margin_bottom=’30px’ icon_select=’yes’ custom_icon_color=” icon=’ue808′ font=’entypo-fontello’]

    [av_textblock size=” font_color=” color=”]
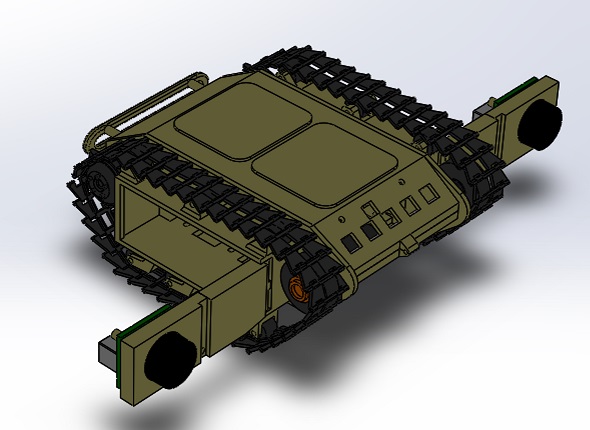
    The e final 3D model design in Solidworks, displaying all exterior components including tracks, wheels, sensors, and PCB cut outs is shown in Figure 6.
    [/av_textblock]

    [av_hr class=’invisible’ height=’20’ shadow=’no-shadow’ position=’center’ custom_border=’av-border-thin’ custom_width=’50px’ custom_border_color=” custom_margin_top=’30px’ custom_margin_bottom=’30px’ icon_select=’yes’ custom_icon_color=” icon=’ue808′ font=’entypo-fontello’]

    [av_textblock size=” font_color=” color=”]

    Figure 6 - Final Design
    Figure 6 – Final Design

    [/av_textblock]

    [av_heading heading=’Conclusion’ tag=’h2′ style=” size=” subheading_active=” subheading_size=’15’ padding=’10’ color=’custom-color-heading’ custom_font=’#ff6a00′][/av_heading]

    [av_textblock size=” font_color=” color=”]
    With the class coming to an end, we have finalized a design that meets the majority of our requirements. We have created a waiver asking to approve the requirement violation of the requirement, where we could not meet the exact appearance of the 302 Goliath because we needed to modify the appearance to include the PCB cut out and the sensors. Overall, the Goliath design was successful, in which we were able to incorporate a functional design for the 3Dot board, PCB, speakers, and motors in a compact size.
    [/av_textblock]

    [/av_one_full]

  • How to Graph In Arduino IDE

    How to Graph In Arduino IDE

    [av_hr class=’invisible’ height=’-60′ shadow=’no-shadow’ position=’center’ custom_border=’av-border-thin’ custom_width=’50px’ custom_border_color=” custom_margin_top=’30px’ custom_margin_bottom=’30px’ icon_select=’yes’ custom_icon_color=” icon=’ue808′ font=’entypo-fontello’]

    [av_three_fourth first min_height=” vertical_alignment=” space=” custom_margin=” margin=’0px’ padding=’0px’ border=” border_color=” radius=’0px’ background_color=” src=” background_position=’top left’ background_repeat=’no-repeat’ animation=”]
    [av_textblock size=’16’ font_color=’custom’ color=’#6b6b6b’]

    [/av_textblock]
    [/av_three_fourth]

    [av_textblock size=” font_color=’custom’ color=’#bfbfbf’]
    By: Sou Thao (Electronics and Control Engineer)

    Approved by Kristen Oduca (Project Manager)
    [/av_textblock]

    [av_one_full first min_height=” vertical_alignment=” space=” custom_margin=” margin=’0px’ padding=’0px’ border=” border_color=” radius=’0px’ background_color=” src=” background_position=’top left’ background_repeat=’no-repeat’ animation=”]

    [av_textblock size=’25’ font_color=” color=”]
    Goliath Fall 2016
    [/av_textblock]

    [av_hr class=’invisible’ height=’-50′ shadow=’no-shadow’ position=’center’ custom_border=’av-border-thin’ custom_width=’50px’ custom_border_color=” custom_margin_top=’30px’ custom_margin_bottom=’30px’ icon_select=’yes’ custom_icon_color=” icon=’ue808′ font=’entypo-fontello’]

    [av_textblock size=’25’ font_color=” color=”]
    How to Graph In Arduino IDE
    [/av_textblock]

    [/av_one_full][av_one_full first min_height=” vertical_alignment=” space=” custom_margin=” margin=’0px’ padding=’0px’ border=” border_color=” radius=’0px’ background_color=” src=” background_position=’top left’ background_repeat=’no-repeat’ animation=”]

    [av_heading tag=’h2′ padding=’10’ heading=’Introuction’ color=’custom-color-heading’ style=” custom_font=’#ff6a00′ size=” subheading_active=” subheading_size=’15’ custom_class=”][/av_heading]

    [av_textblock size=” font_color=” color=”]
    Requirement: Goliath should use triangulation to find the location of the Biped.

    In order to troubleshoot errors caused in the code and the control algorithm, we needed to find a way to graph the sensors to determine what values they are seeing.  To create these graphs, there are many programs that will enable a user to interface an Arduino board to their software including Matlab and Processing.  By far the easiest and fastest way to create a graph is through using the newest feature in the Arduino IDE, the Serial Plotter.  The Serial Plotter allows a user to graph a certain value in real time.  Similar to how a user uses the Serial.print command to see the values in the Serial Monitor, the Serial Plotter uses the Serial.print command to plot the values in the Serial Plotter Window.  Thus, one will be able to plot their sensor’s values or different datas with ease.
    [/av_textblock]

    [av_heading heading=’How to Graph Using the Serial Plotter’ tag=’h2′ style=” size=” subheading_active=” subheading_size=’15’ padding=’10’ color=’custom-color-heading’ custom_font=’#ff6a00′][/av_heading]

    [av_textblock size=” font_color=” color=”]
    By following the instructions stated from instructables  to plot a single variable, a user must write the Serial.println(variableName) command [1].  Then under the Tools Menu on the top of the IDE, the user must select Serial Plotter and run their code after that.  The program will automatically start plotting the variable in real time, and auto adjust the y-axis as the variable moves along.  Sometimes, it will take the y-axis some time to self adjust because 500 points are plotted on the x axis.  Therefore, a user will not be able to detect exactly where their values are, but they can get a good estimate.  To plot more than one variable, a user starts with the Serial.print(variable) command.  Then they must put a space in between the variables using either Serial.print(“ “) or Serial.print(“\t”).  After that, the user ends the graphs with the last variable using the Serial.println(variable) command.  Notice the “ln” at the end.  The user must use this statement in order to be able to graph all the variables, otherwise, the Serial Plotter will not graph the sensors.  As a result, we use these steps and were able to graph the sensors to help us troubleshoot the control algorithm.
    [/av_textblock]

    [av_heading heading=’Writing the Algorithm’ tag=’h2′ style=” size=” subheading_active=” subheading_size=’15’ padding=’10’ color=’custom-color-heading’ custom_font=’#ff6a00′][/av_heading]

    [av_textblock size=” font_color=” color=”]
    We wanted to graph the left and right sensor to determine what the sensors are seeing as an object is placed in front of it.  Therefore, by running the extra code below to our original code and using the Serial Plotter, we were able to create a graph of our data.  This helped us in fine tuning our code and adjust different parameters in the control algorithm.  Also, it helped us to determine a good size for the running averaging filter so we can track an object effectively shown in Figure 1.
    [/av_textblock]

    [av_hr class=’invisible’ height=’20’ shadow=’no-shadow’ position=’center’ custom_border=’av-border-thin’ custom_width=’50px’ custom_border_color=” custom_margin_top=’30px’ custom_margin_bottom=’30px’ icon_select=’yes’ custom_icon_color=” icon=’ue808′ font=’entypo-fontello’]

    [av_textblock size=” font_color=” color=”]

    Figure 1 - Graphed Data
    Figure 1 – Graphed Data

    [/av_textblock]

    [av_heading heading=’Conclusion’ tag=’h2′ style=” size=” subheading_active=” subheading_size=’15’ padding=’10’ color=’custom-color-heading’ custom_font=’#ff6a00′][/av_heading]

    [av_textblock size=” font_color=” color=”]
    By plotting our sensor values using the Arduino Serial Plotter, we were able to see what happens when we move an object in front of the sensor.  The sensor value did not jump around as much because we had a running averaging filter on both sensors.  With the help of the Serial Plotter, we were able to adjust our PI controller in our control algorithm to make Goliath follow BiPed accurately.  Thus, any user is able to use this new feature on the Arduino IDE in order to quickly graph their data and see how their data is changing.
    [/av_textblock]

    [/av_one_full][av_hr class=’invisible’ height=’20’ shadow=’no-shadow’ position=’center’ custom_border=’av-border-thin’ custom_width=’50px’ custom_border_color=” custom_margin_top=’30px’ custom_margin_bottom=’30px’ icon_select=’yes’ custom_icon_color=” icon=’ue808′ font=’entypo-fontello’]

    [av_textblock size=” font_color=’custom’ color=’#ff6a00′]
    Source Material

    1. http://www.instructables.com/id/Ultimate-Guide-to-Adruino-Serial-Plotter/

    [/av_textblock]

  • Playing Tank Noises

    Playing Tank Noises

    [av_one_full first min_height=” vertical_alignment=” space=” custom_margin=” margin=’0px’ padding=’0px’ border=” border_color=” radius=’0px’ background_color=” src=” background_position=’top left’ background_repeat=’no-repeat’ animation=”]
    [av_textblock size=’25’ font_color=” color=”]
    Goliath Fall 2016
    [/av_textblock]

    [av_hr class=’invisible’ height=’-50′ shadow=’no-shadow’ position=’center’ custom_border=’av-border-thin’ custom_width=’50px’ custom_border_color=” custom_margin_top=’30px’ custom_margin_bottom=’30px’ icon_select=’yes’ custom_icon_color=” icon=’ue808′ font=’entypo-fontello’]

    [av_textblock size=’25’ font_color=” color=”]
    Playing Tank Noises
    [/av_textblock]
    [/av_one_full]

    [av_hr class=’invisible’ height=’-60′ shadow=’no-shadow’ position=’center’ custom_border=’av-border-thin’ custom_width=’50px’ custom_border_color=” custom_margin_top=’30px’ custom_margin_bottom=’30px’ icon_select=’yes’ custom_icon_color=” icon=’ue808′ font=’entypo-fontello’]

    [av_textblock size=” font_color=’custom’ color=’#bfbfbf’]
    By: Sou Thao (Electronics and Control Engineer)

    Approved by Kristen Oduca (Project Manager)
    [/av_textblock]

    [av_three_fourth first min_height=” vertical_alignment=” space=” custom_margin=” margin=’0px’ padding=’0px’ border=” border_color=” radius=’0px’ background_color=” src=” background_position=’top left’ background_repeat=’no-repeat’ animation=”]
    [av_textblock size=’16’ font_color=’custom’ color=’#6b6b6b’]

    [/av_textblock]
    [/av_three_fourth]

    [av_one_full first min_height=” vertical_alignment=” space=” custom_margin=” margin=’0px’ padding=’0px’ border=” border_color=” radius=’0px’ background_color=” src=” background_position=’top left’ background_repeat=’no-repeat’ animation=”]
    [av_heading tag=’h2′ padding=’10’ heading=’Introuction’ color=’custom-color-heading’ style=” custom_font=’#ff6a00′ size=” subheading_active=” subheading_size=’15’ custom_class=”][/av_heading]

    [av_textblock size=” font_color=” color=”]
    Requirement: Goliath should make motor noises during the game that fall between 20 to 65dB.

    We used a 8 ohm 0.5W speaker connected to our PCB.  The 8 ohm speaker was chosen instead of the piezo speaker because it has better sound contrast and better sound quality.  Playing sound continuously requires the use of timer interrupts.  Timer interrupts work by interrupting the program running at certain time intervals to call a function.  After the function is called and the code executed, it will return back to the program where it was interrupted to run the next code.  By doing this, we are able to continuously interrupt the program to play our tank noise.
    [/av_textblock]

    [av_heading tag=’h2′ padding=’10’ heading=’Obtaining the Notes to Play a Tank Noise’ color=’custom-color-heading’ style=” custom_font=’#ff6a00′ size=” subheading_active=” subheading_size=’15’ custom_class=”][/av_heading]

    [av_textblock size=” font_color=” color=”]
    In order to get the tank noise, we went on youtube to decipher the notes for playing a tank noise [1]Because the tone function uses notes based on frequency similar to keys on the piano, we used a tuner life app to help us decipher the notes of the tank noise.  After deciphering the tank noise, the notes were:

    NOTE_E3, NOTE_A2, NOTE_B2, NOTE_F1, NOTE_CS1, NOTE_E1, NOTE_D1, NOTE_AS3, NOTE_E3, NOTE_E2, NOTE_B2, NOTE_E3, NOTE_F2, NOTE_AS1, NOTE_D3, NOTE_B3,

    NOTE_CS2, and NOTE_E3.

    Now that we were able to obtain the notes for the tank noise, we had to find a way to use interrupts in play the tank noise.  When searching online, we found a library to use Timer 1 Interrupts [2]. To use the Timer 1 Interrupt, we first initialized the time the timer should interrupt the program in microseconds using Timer1.initialize(microseconds).  After that, we need to attach a function to the timer interrupt in order to play our tank noise using Timer1.attachInterrupt(function).  Thus, we will be able to play the tank noise continuously throughout the game.
    [/av_textblock]

    [av_hr class=’invisible’ height=’20’ shadow=’no-shadow’ position=’center’ custom_border=’av-border-thin’ custom_width=’50px’ custom_border_color=” custom_margin_top=’30px’ custom_margin_bottom=’30px’ icon_select=’yes’ custom_icon_color=” icon=’ue808′ font=’entypo-fontello’]

    [av_textblock size=” font_color=” color=”]
    For the sensors, our goal was to find the ideal placement without compromising the size of the Goliath. In the images, we considered enclosing the sensors in the front top as shown in Figure 1.
    [/av_textblock]

    [av_heading tag=’h2′ padding=’10’ heading=’Writing the Tank Noise Algorithm’ color=’custom-color-heading’ style=” custom_font=’#ff6a00′ size=” subheading_active=” subheading_size=’15’ custom_class=”][/av_heading]

    [av_textblock size=” font_color=” color=”]
    //pitches.h file converts notes to PWM frequency values

    #include “pitches.h”

    //We have to include the Timer 1 Library to use interrupts

    #include

    //thisNote is used as a counter to play each note

    int thisNote;

    //the notes for the tank noise

    int melody[] = {

     NOTE_E3, NOTE_A2, NOTE_B2, NOTE_F1,

     NOTE_CS1, NOTE_E1, NOTE_D1, NOTE_AS3,

     NOTE_E3, NOTE_E2, NOTE_B2, NOTE_E3,

     NOTE_F2, NOTE_AS1, NOTE_D3, NOTE_B3,

     NOTE_CS2, NOTE_E3

    };

    void setup() {

    Serial.begin(9600);

    Timer3.initialize(8000);

    }

    void loop() {

    Timer3.attachInterrupt(play);

    }

    void play(){

    //play the sound from the first note to the last

     int size = sizeof(melody) / sizeof(int);

    thisNote++;

    if (thisNote == size){

     thisNote = 0;}

    tone(13, melody[thisNote],8);

    }
    [/av_textblock]

    [av_heading tag=’h2′ padding=’10’ heading=’Problems Faced Using Timer 1 and Timer 3 Interrupts’ color=’custom-color-heading’ style=” custom_font=’#ff6a00′ size=” subheading_active=” subheading_size=’15’ custom_class=”][/av_heading]

    [av_textblock size=” font_color=” color=”]
    We were not able to use the timer1 on the 3Dot Board because it will interfere with the analogWrite PWM for the motors if we used the 3DoT Library [2].  Timer1 affects the analog pins 9, 10, and 11.  On the 3DoT Library, we controlled motor A by calling motorA.begin(5,10,9).  As a result, pin 9 was affected when we used timer1 interrupt in our code to run the tank noise while running our motors in the program.
    [/av_textblock]

    [av_hr class=’invisible’ height=’20’ shadow=’no-shadow’ position=’center’ custom_border=’av-border-thin’ custom_width=’50px’ custom_border_color=” custom_margin_top=’30px’ custom_margin_bottom=’30px’ icon_select=’yes’ custom_icon_color=” icon=’ue808′ font=’entypo-fontello’]

    [av_textblock size=” font_color=” color=”]
    Next, we tried using timer3 interrupts.  According to this website, the timer2 uses the tone function needed to play the tank noise [3].  However, since the atmega32u4 processor does not have a timer2, the tone function uses timer3 to control the pwm for the frequencies.  Therefore, when we tested the timer3 interrupt to run our tank noise, there were no interrupts because the tone function would not run.
    [/av_textblock]

    [av_heading tag=’h2′ padding=’10’ heading=’Conclusion’ color=’custom-color-heading’ style=” custom_font=’#ff6a00′ size=” subheading_active=” subheading_size=’15’ custom_class=”][/av_heading]

    [av_textblock size=” font_color=” color=”]
    By using timer interrupts, we were able to get the tank noise to work continuously throughout the code.  However, when we ran our motors, the timer 1 interrupt affected the PWM speed of motor A.  Timer 3 interrupt did not run because the tone function could not be used to play the notes from the tank noise.  As a result, we chose to play the tank noise in the setup of our code to show that we were able to obtain a noise similar to a tank.  However, because we ran into issues with the timer interrupts, we were not able to play the tank noise continuously throughout the code.  Due to the time limits, future students should try using timer 4 interrupts to see if they can get the tank noise to play continuously throughout the code.  
    [/av_textblock]

    [av_hr class=’invisible’ height=’20’ shadow=’no-shadow’ position=’center’ custom_border=’av-border-thin’ custom_width=’50px’ custom_border_color=” custom_margin_top=’30px’ custom_margin_bottom=’30px’ icon_select=’yes’ custom_icon_color=” icon=’ue808′ font=’entypo-fontello’]

    [av_textblock size=” font_color=’custom’ color=’#ff6a00′]
    Source Material

    1. https://youtu.be/8UZCQmCcpoA
    2. https://www.pjrc.com/teensy/td_libs_TimerOne.html
    3. https://arduino-info.wikispaces.com/Timers-Arduino

    [/av_textblock]
    [/av_one_full]

  • PCB Assembly

    PCB Assembly

    [av_one_full first min_height=” vertical_alignment=” space=” custom_margin=” margin=’0px’ padding=’0px’ border=” border_color=” radius=’0px’ background_color=” src=” background_position=’top left’ background_repeat=’no-repeat’ animation=”]

    [av_textblock size=’25’ font_color=” color=”]
    Goliath Fall 2016
    [/av_textblock]

    [av_hr class=’invisible’ height=’-50′ shadow=’no-shadow’ position=’center’ custom_border=’av-border-thin’ custom_width=’50px’ custom_border_color=” custom_margin_top=’30px’ custom_margin_bottom=’30px’ icon_select=’yes’ custom_icon_color=” icon=’ue808′ font=’entypo-fontello’]

    [av_textblock size=’25’ font_color=” color=”]
    PCB Assembly
    [/av_textblock]

    [/av_one_full][av_hr class=’invisible’ height=’-60′ shadow=’no-shadow’ position=’center’ custom_border=’av-border-thin’ custom_width=’50px’ custom_border_color=” custom_margin_top=’30px’ custom_margin_bottom=’30px’ icon_select=’yes’ custom_icon_color=” icon=’ue808′ font=’entypo-fontello’]

    [av_textblock size=” font_color=’custom’ color=’#bfbfbf’]
    By: Dylan Hong (Design and Manufacturing Engineer)

    Approved by Kristen Oduca (Project Manager)
    [/av_textblock]

    [av_three_fourth first min_height=” vertical_alignment=” space=” custom_margin=” margin=’0px’ padding=’0px’ border=” border_color=” radius=’0px’ background_color=” src=” background_position=’top left’ background_repeat=’no-repeat’ animation=”]
    [av_textblock size=’16’ font_color=’custom’ color=’#6b6b6b’]

    [/av_textblock]
    [/av_three_fourth]

    [av_one_full first min_height=” vertical_alignment=” space=” custom_margin=” margin=’0px’ padding=’0px’ border=” border_color=” radius=’0px’ background_color=” src=” background_position=’top left’ background_repeat=’no-repeat’ animation=”]

    [av_heading tag=’h2′ padding=’10’ heading=’Introuction’ color=’custom-color-heading’ style=” custom_font=’#ff6a00′ size=” subheading_active=” subheading_size=’15’ custom_class=”][/av_heading]

    [av_textblock size=” font_color=” color=”]
    Requirement:

    1.  Goliath shall have a custom PCB
      1. Goliath shall use five SMD LEDs to indicate the location and distance of the Biped
      2. Goliath should make motor noises during the game that fall between 20 to 65dB (based on human hearing)

    Now that we have received our manufactured PCB and stencil from Oshpark, we may now assemble the SMT electronic components onto the board. The electronic components that we are using are mentioned in the PCB Layout Blog Post.
    [/av_textblock]

    [av_heading heading=’PCB Assembly’ tag=’h2′ style=” size=” subheading_active=” subheading_size=’15’ padding=’10’ color=’custom-color-heading’ custom_font=’#ff6a00′][/av_heading]

    [av_textblock size=” font_color=” color=”]
    In order to assemble our PCB we must first gather the correct tools to handle the components and the PCB.
    [/av_textblock]

    [av_hr class=’invisible’ height=’20’ shadow=’no-shadow’ position=’center’ custom_border=’av-border-thin’ custom_width=’50px’ custom_border_color=” custom_margin_top=’30px’ custom_margin_bottom=’30px’ icon_select=’yes’ custom_icon_color=” icon=’ue808′ font=’entypo-fontello’]

    [av_textblock size=” font_color=” color=”]
    Tools:

    1. Tweezers
    2. Clamp
    3. Solder paste
    4. Solder flux
    5. Magnifying glass
    6. Solder wick
    7. Oven
    8. Card to spread the solder paste (provided by Oshpark if you purchased a stencil)

    [/av_textblock]

    [av_hr class=’invisible’ height=’20’ shadow=’no-shadow’ position=’center’ custom_border=’av-border-thin’ custom_width=’50px’ custom_border_color=” custom_margin_top=’30px’ custom_margin_bottom=’30px’ icon_select=’yes’ custom_icon_color=” icon=’ue808′ font=’entypo-fontello’]

    [av_textblock size=” font_color=” color=”]
    Now that we have gathered our tools, we then placed our PCB in a secure position to apply our stencil and spread the solder paste evenly with the card provided by Oshpark. Since we have components on both the top and bottom layer of the PCB, we decided to start with the bottom because it consists of more complicated components such as the PWM IC shown in Figure 1.
    [/av_textblock]

    [av_hr class=’invisible’ height=’20’ shadow=’no-shadow’ position=’center’ custom_border=’av-border-thin’ custom_width=’50px’ custom_border_color=” custom_margin_top=’30px’ custom_margin_bottom=’30px’ icon_select=’yes’ custom_icon_color=” icon=’ue808′ font=’entypo-fontello’]

    [av_textblock size=” font_color=” color=”]

    Figure 1 - Back of PCB Board
    Figure 1 – Back of PCB Board

    [/av_textblock]

    [av_hr class=’invisible’ height=’20’ shadow=’no-shadow’ position=’center’ custom_border=’av-border-thin’ custom_width=’50px’ custom_border_color=” custom_margin_top=’30px’ custom_margin_bottom=’30px’ icon_select=’yes’ custom_icon_color=” icon=’ue808′ font=’entypo-fontello’]

    [av_textblock size=” font_color=” color=”]
    After spreading the bottom layer with solder paste, we gently place the components to its rightful location with the use of the clamp to hold the PCB secure and still and the tweezer to hold the components.
    [/av_textblock]

    [av_hr class=’invisible’ height=’20’ shadow=’no-shadow’ position=’center’ custom_border=’av-border-thin’ custom_width=’50px’ custom_border_color=” custom_margin_top=’30px’ custom_margin_bottom=’30px’ icon_select=’yes’ custom_icon_color=” icon=’ue808′ font=’entypo-fontello’]

    [av_textblock size=” font_color=” color=”]
    In reference to the SMD Soldering tutorial posted in the Technical Training folder on the EE 400D website, we preheated the oven to 350F for about 5 minutes and placed the PCB in for about a minute, then we increased the temperature to the max temperature of about 450F until the solder paste was visibly shining and hardening (about 2 and a half minutes).
    [/av_textblock]

    [av_hr class=’invisible’ height=’20’ shadow=’no-shadow’ position=’center’ custom_border=’av-border-thin’ custom_width=’50px’ custom_border_color=” custom_margin_top=’30px’ custom_margin_bottom=’30px’ icon_select=’yes’ custom_icon_color=” icon=’ue808′ font=’entypo-fontello’]

    [av_textblock size=” font_color=” color=”]
    Next, we carefully removed the PCB and waited for it to cool down to room temperature before handling the top layer shown in Figure 2.
    [/av_textblock]

    [av_hr class=’invisible’ height=’20’ shadow=’no-shadow’ position=’center’ custom_border=’av-border-thin’ custom_width=’50px’ custom_border_color=” custom_margin_top=’30px’ custom_margin_bottom=’30px’ icon_select=’yes’ custom_icon_color=” icon=’ue808′ font=’entypo-fontello’]

    [av_textblock size=” font_color=” color=”]

    Figure 2 - Front of PCB Board
    Figure 2 – Front of PCB Board

    [/av_textblock]

    [av_hr class=’invisible’ height=’20’ shadow=’no-shadow’ position=’center’ custom_border=’av-border-thin’ custom_width=’50px’ custom_border_color=” custom_margin_top=’30px’ custom_margin_bottom=’30px’ icon_select=’yes’ custom_icon_color=” icon=’ue808′ font=’entypo-fontello’]

    [av_textblock size=” font_color=” color=”]
    For the top layer, we considered reflowing it the same way as we did the bottom layer but we came across a problem where the PCB would have to be baked twice, which may cause the bottom layer components to fall down or be shifted out of place causing tombstones. So to prevent any mishaps for the bottom layer, we decided to hand solder the top layer which was not too difficult because the top layer only consisted of 8 components. When assembling, be sure to double check the polarity of the components are placed correctly to avoid any shorts. Also, be sure to test the LEDs are functioning correctly with the use of a DMM. The only problem with hand soldering SMD components is that the results were not pretty because the components were not aligned as well as the bottom components. Last but not least, the male header pins were all that was left to solder onto the PCB.
    [/av_textblock]

    [av_heading heading=’Trim Pot’ tag=’h2′ style=” size=” subheading_active=” subheading_size=’15’ padding=’10’ color=’custom-color-heading’ custom_font=’#ff6a00′][/av_heading]

    [av_textblock size=” font_color=” color=”]
    Also, a problem that we came across was that the trim pot in the schematic was wired incorrectly on EACGLE CAD, which resulted in the PCB layout and manufacturing to be incorrect. However, we were able to bypass the problem by hand soldering the leads of the trim pot to the correct pads on the PCB via copper wire.
    [/av_textblock]

    [av_heading tag=’h2′ padding=’10’ heading=’Conclusion’ color=’custom-color-heading’ style=” custom_font=’#ff6a00′ size=” subheading_active=” subheading_size=’15’ custom_class=”][/av_heading]

    [av_textblock size=” font_color=” color=”]
    Overall, our PCB assembly of the bottom layer and top layer was successful. We were able to lay all of the components correctly without damaging the PCB. We learned the techniques of how to SMD solder, which we found much more useful than the time consuming of hand soldering. The use of the stencil cut our work time by half and provided a much cleaner layout. Some improvements that we can consider in the future would be to use the method of stenciling the top and bottom layer and baking it twice with the use of Kapton tape to hold down the bottom components from falling down, which was the method that the Bionic Hand used to achieve a successful PCB assembly for both the top and bottom components. Also, we will have the E&C division manager to double check our schematic to make sure all components are wired correctly to prevent errors within the board layout and manufacturing. After the PCB assembly, we can expect our E&C to test the speakers, control algorithm and its integration with the LEDs.
    [/av_textblock]

    [/av_one_full]

  • PCB Schematic

    PCB Schematic

    [av_one_full first min_height=” vertical_alignment=” space=” custom_margin=” margin=’0px’ padding=’0px’ border=” border_color=” radius=’0px’ background_color=” src=” background_position=’top left’ background_repeat=’no-repeat’ animation=”]
    [av_textblock size=’25’ font_color=” color=”]
    Goliath Fall 2016
    [/av_textblock]

    [av_hr class=’invisible’ height=’-50′ shadow=’no-shadow’ position=’center’ custom_border=’av-border-thin’ custom_width=’50px’ custom_border_color=” custom_margin_top=’30px’ custom_margin_bottom=’30px’ icon_select=’yes’ custom_icon_color=” icon=’ue808′ font=’entypo-fontello’]

    [av_textblock size=’25’ font_color=” color=”]
    PCB Schematic
    [/av_textblock]
    [/av_one_full]

    [av_hr class=’invisible’ height=’-60′ shadow=’no-shadow’ position=’center’ custom_border=’av-border-thin’ custom_width=’50px’ custom_border_color=” custom_margin_top=’30px’ custom_margin_bottom=’30px’ icon_select=’yes’ custom_icon_color=” icon=’ue808′ font=’entypo-fontello’]

    [av_textblock size=” font_color=’custom’ color=’#bfbfbf’]
    By: Sou Thao (Electronics and Control)

    Approved by Kristen Oduca (Project Manager)
    [/av_textblock]

    [av_three_fourth first min_height=” vertical_alignment=” space=” custom_margin=” margin=’0px’ padding=’0px’ border=” border_color=” radius=’0px’ background_color=” src=” background_position=’top left’ background_repeat=’no-repeat’ animation=”]
    [av_textblock size=’16’ font_color=’custom’ color=’#6b6b6b’]

    [/av_textblock]
    [/av_three_fourth]

    [av_one_full first min_height=” vertical_alignment=” space=” custom_margin=” margin=’0px’ padding=’0px’ border=” border_color=” radius=’0px’ background_color=” src=” background_position=’top left’ background_repeat=’no-repeat’ animation=”]

    [av_heading tag=’h2′ padding=’10’ heading=’Introduction’ color=’custom-color-heading’ style=” custom_font=’#ff6a00′ size=” subheading_active=” subheading_size=’15’ custom_class=”][/av_heading]

    [av_textblock size=” font_color=” color=”]
    Requirement:

    • Goliath shall have a custom PCB.
      • Goliath shall use five SMD LEDs to indicate the location and distance of the Biped.

    The components selected for the PCB must be laid out in the schematic.  The schematic shows the interconnections between the different components so a user is able to understand the pinouts of the PCB.  In our schematic, we will be using RGB LEDs to show the distance and direction of the object being tracked and we will be using a speaker for tank noises.  After the schematic is finished, it will go to the manufacturer engineer who will lay out the components on the actual PCB and it will come back to electronics engineer for testing.  
    [/av_textblock]

    [av_heading tag=’h2′ padding=’10’ heading=’EagleCAD Schematic’ color=’custom-color-heading’ style=” custom_font=’#ff6a00′ size=” subheading_active=” subheading_size=’15’ custom_class=”][/av_heading]

    [av_textblock size=” font_color=” color=”]
    By looking at the schematic in Figure 1, the main component driving the RGB LEDs is the PCA9685 I2C expander.
    [/av_textblock]

    [av_hr class=’invisible’ height=’20’ shadow=’no-shadow’ position=’center’ custom_border=’av-border-thin’ custom_width=’50px’ custom_border_color=” custom_margin_top=’30px’ custom_margin_bottom=’30px’ icon_select=’yes’ custom_icon_color=” icon=’ue808′ font=’entypo-fontello’]

    [av_textblock size=” font_color=” color=”]

    Figure 1 - PCB Schematic
    Figure 1 – PCB Schematic

    [/av_textblock]

    [av_hr class=’invisible’ height=’20’ shadow=’no-shadow’ position=’center’ custom_border=’av-border-thin’ custom_width=’50px’ custom_border_color=” custom_margin_top=’30px’ custom_margin_bottom=’30px’ icon_select=’yes’ custom_icon_color=” icon=’ue808′ font=’entypo-fontello’]

    [av_textblock size=” font_color=” color=”]
    We used this I2C expander because we were limited in the number of pins on the 3DoT Board, especially the PWM/analog pins.  Thus, the solution was to communicate through the I2C bus on the microcontroller.  As a result, any user can connect multiple devices through the I2C bus, which only uses two pins for serial communication.
    [/av_textblock]

    [av_hr class=’invisible’ height=’20’ shadow=’no-shadow’ position=’center’ custom_border=’av-border-thin’ custom_width=’50px’ custom_border_color=” custom_margin_top=’30px’ custom_margin_bottom=’30px’ icon_select=’yes’ custom_icon_color=” icon=’ue808′ font=’entypo-fontello’]

    [av_textblock size=” font_color=” color=”]
    Next, we had to select the correct resistors for turning on each LED.  We decided to use five SMD Common Cathode RGB LEDs from Adafruit, and by looking at the technical details of the LEDs, we can see that the turn on voltages for each LED is: Red – 1.8 to 2.1V, Green – 3 to 3.2V, and Blue – 3 to 3.2V [1].  Also we know that the voltage supply to each pin is 3.3V from the power source coming from the I2C bus.  Next, from the PCA9685 datasheet the sink current on each pinout of the I2C expander is 25mA [2].  Therefore, to get the resistor value, we can use the formula shown in Figure 2:
    [/av_textblock]

    [av_hr class=’invisible’ height=’20’ shadow=’no-shadow’ position=’center’ custom_border=’av-border-thin’ custom_width=’50px’ custom_border_color=” custom_margin_top=’30px’ custom_margin_bottom=’30px’ icon_select=’yes’ custom_icon_color=” icon=’ue808′ font=’entypo-fontello’]

    [av_textblock size=” font_color=” color=”]

    Figure 2 - Calculating Resistor Values
    Figure 2 – Calculating Resistor Values

    [/av_textblock]

    [av_hr class=’invisible’ height=’20’ shadow=’no-shadow’ position=’center’ custom_border=’av-border-thin’ custom_width=’50px’ custom_border_color=” custom_margin_top=’30px’ custom_margin_bottom=’30px’ icon_select=’yes’ custom_icon_color=” icon=’ue808′ font=’entypo-fontello’]

    [av_textblock size=” font_color=” color=”]
    Therefore, we chose our resistor values to be Red = 47Ω, Green = 10Ω, and Blue = 10Ω for each RGB LED.
    [/av_textblock]

    [av_hr class=’invisible’ height=’20’ shadow=’no-shadow’ position=’center’ custom_border=’av-border-thin’ custom_width=’50px’ custom_border_color=” custom_margin_top=’30px’ custom_margin_bottom=’30px’ icon_select=’yes’ custom_icon_color=” icon=’ue808′ font=’entypo-fontello’]

    [av_textblock size=” font_color=” color=”]
    Next up, we created mounting holes for each MaxSonar Sensor so they can connect with the I2C bus.  On the datasheet for the sensor on page 4 located here, we would need pull up resistors from the 5V to the SDA and 5V to the SCL so we chose two resistor values of 2.2kΩ [3].  Moving forward, the capacitors are placed from the power source to ground and from any component pin that requires power to ground because they work as decoupling capacitors.  The purpose of a decoupling capacitor is to block out the high-frequency noise from the power supply signal which can harm the ICs.  
    [/av_textblock]

    [av_hr class=’invisible’ height=’20’ shadow=’no-shadow’ position=’center’ custom_border=’av-border-thin’ custom_width=’50px’ custom_border_color=” custom_margin_top=’30px’ custom_margin_bottom=’30px’ icon_select=’yes’ custom_icon_color=” icon=’ue808′ font=’entypo-fontello’]

    [av_textblock size=” font_color=” color=”]
    On the last part, we chose to use a speaker to make tank noises.  In order to connect the 8 ohm 0.5W speaker to the PCB, we used a transistor that was controlled by the PWM signal from the servo header pin on the 3DoT board.  We biased the transistor to work in the saturation region for the purpose of turning on and turning off the power supply to the speaker, therefore, we can create a tank noise.  We also included a potentiometer in this circuit to have volume control if the speaker gets too loud.  
    [/av_textblock]

    [av_heading tag=’h2′ padding=’10’ heading=’Testing the PCB’ color=’custom-color-heading’ style=” custom_font=’#ff6a00′ size=” subheading_active=” subheading_size=’15’ custom_class=”][/av_heading]

    [av_textblock size=” font_color=” color=”]
    After the manufacturing engineer designed the PCB, I was able to test the PCB with the code I had written from the previous blog post on the new control algorithm using triangulation.  As expected, the LEDs displayed the correct lighting effect for direction and distance of an object detected and the sensors were able to track an object with ease.  I was able to play the tank noise from the speaker, and our code ran perfectly as it did with our breadboard tests.
    [/av_textblock]

    [av_heading tag=’h2′ padding=’10’ heading=’Conclusion’ color=’custom-color-heading’ style=” custom_font=’#ff6a00′ size=” subheading_active=” subheading_size=’15’ custom_class=”][/av_heading]

    [av_textblock size=” font_color=” color=”]

    From the breadboard connections, we were able to shrink our components and create a PCB 
    that can be use on our Goliath to run the codes necessary to track an object. The schematic 
    helped to lay out our components and simplify our circuitry. After receiving our PCB, the testing proved that the PCB worked with all of our components including the sensors, LEDs, and speaker. As a result of the PCB, we were able to create a simple, yet powerful board that can help us troubleshoot problems with our codes. This board is double side and is very small, which can be integrated into any future projects. The PCB helped to move our design forward in helping us to fulfill our requirement of having a PCB and having a visual display of the object being tracked.

    [/av_textblock]

    [av_hr class=’invisible’ height=’20’ shadow=’no-shadow’ position=’center’ custom_border=’av-border-thin’ custom_width=’50px’ custom_border_color=” custom_margin_top=’30px’ custom_margin_bottom=’30px’ icon_select=’yes’ custom_icon_color=” icon=’ue808′ font=’entypo-fontello’]

    [av_textblock size=” font_color=’custom’ color=’#ff6a00′]
    Source Material

    1. https://www.adafruit.com/product/619
    2. https://cdn-shop.adafruit.com/datasheets/PCA9685.pdf
    3. http://www.maxbotix.com/documents/I2CXL-MaxSonar-EZ_Datasheet.pdf

    [/av_textblock]

    [/av_one_full]

  • Control Algorithm Using Triangulation

    Control Algorithm Using Triangulation

    [av_one_full first min_height=” vertical_alignment=” space=” custom_margin=” margin=’0px’ padding=’0px’ border=” border_color=” radius=’0px’ background_color=” src=” background_position=’top left’ background_repeat=’no-repeat’ animation=”]
    [av_textblock size=’25’ font_color=” color=”]
    Goliath Fall 2016
    [/av_textblock]

    [av_hr class=’invisible’ height=’-50′ shadow=’no-shadow’ position=’center’ custom_border=’av-border-thin’ custom_width=’50px’ custom_border_color=” custom_margin_top=’30px’ custom_margin_bottom=’30px’ icon_select=’yes’ custom_icon_color=” icon=’ue808′ font=’entypo-fontello’]

    [av_textblock size=’25’ font_color=” color=”]
    Control Algorithm Using Triangulation
    [/av_textblock]
    [/av_one_full]

    [av_hr class=’invisible’ height=’-60′ shadow=’no-shadow’ position=’center’ custom_border=’av-border-thin’ custom_width=’50px’ custom_border_color=” custom_margin_top=’30px’ custom_margin_bottom=’30px’ icon_select=’yes’ custom_icon_color=” icon=’ue808′ font=’entypo-fontello’]

    [av_textblock size=” font_color=’custom’ color=’#bfbfbf’]
    By: Sou Thao (Electronics and Control Engineer)

    Approved by Kristen Oduca (Project Manager)
    [/av_textblock]

    [av_three_fourth first min_height=” vertical_alignment=” space=” custom_margin=” margin=’0px’ padding=’0px’ border=” border_color=” radius=’0px’ background_color=” src=” background_position=’top left’ background_repeat=’no-repeat’ animation=”]
    [av_textblock size=’16’ font_color=’custom’ color=’#6b6b6b’]

    [/av_textblock]
    [/av_three_fourth]

    [av_one_full first min_height=” vertical_alignment=” space=” custom_margin=” margin=’0px’ padding=’0px’ border=” border_color=” radius=’0px’ background_color=” src=” background_position=’top left’ background_repeat=’no-repeat’ animation=”]

    [av_heading tag=’h2′ padding=’10’ heading=’Introduction’ color=’custom-color-heading’ style=” custom_font=’#ff6a00′ size=” subheading_active=” subheading_size=’15’ custom_class=”][/av_heading]

    [av_textblock size=” font_color=” color=”]
    Requirement: The Goliath shall follow the biped at a distance of 20 inches with 15% margin of error.

    In order to follow BiPed autonomously within a range of 20 inches, a new control algorithm needs to be created.  The control algorithm translates the sensor’s values into Pulse Width Modulated values to control the motors until the Goliath has reached a set point.  In turn, the control algorithm should incorporate triangulation in order to control its motors.  Triangulation consists of determining a location using the geometric formulas of a triangle including the laws of sine and cosine.  By finding the sides and angles of the triangle formed by the sensors and the object, we will be able to use our control algorithm to keep the middle distance and middle angle at a designated set point near 20 inches and 90° respectively.
    [/av_textblock]

    [av_heading tag=’h2′ padding=’10’ heading=’Determining an Object’s Distance Using Triangulation’ color=’custom-color-heading’ style=” custom_font=’#ff6a00′ size=” subheading_active=” subheading_size=’15’ custom_class=”][/av_heading]

    [av_textblock size=” font_color=” color=”]
    From Figure 1, we can see that when both sensors detect an object, we get a triangle.
    [/av_textblock]

    [av_hr class=’invisible’ height=’20’ shadow=’no-shadow’ position=’center’ custom_border=’av-border-thin’ custom_width=’50px’ custom_border_color=” custom_margin_top=’30px’ custom_margin_bottom=’30px’ icon_select=’yes’ custom_icon_color=” icon=’ue808′ font=’entypo-fontello’]

    [av_textblock size=” font_color=” color=”]
    figure-1-sensor-detecting-an-object
    [/av_textblock]

    [av_hr class=’invisible’ height=’20’ shadow=’no-shadow’ position=’center’ custom_border=’av-border-thin’ custom_width=’50px’ custom_border_color=” custom_margin_top=’30px’ custom_margin_bottom=’30px’ icon_select=’yes’ custom_icon_color=” icon=’ue808′ font=’entypo-fontello’]

    [av_textblock size=” font_color=” color=”]
    2c represents the distance both sensors are separated, a represents the distance the object is detected by the left sensor, and b represents the distance the object is detected by the right sensor.  The distance d represents the distance from the center of the two sensors to the object and the angles A, B, and C correspond to their sides respectively.  Angle θ is the angle where line d intersects the line 2c.  In our case, we want to find the distance d and the angle θ so we can develop a control algorithm to keep those values close to our set point of 20 inches and 90°.  To find both of them, we have to use the laws of sine and cosine.  By looking at the big triangle, according to Wolfram MathWorld shown in Figure 2  [1].
    [/av_textblock]

    [av_hr class=’invisible’ height=’20’ shadow=’no-shadow’ position=’center’ custom_border=’av-border-thin’ custom_width=’50px’ custom_border_color=” custom_margin_top=’30px’ custom_margin_bottom=’30px’ icon_select=’yes’ custom_icon_color=” icon=’ue808′ font=’entypo-fontello’]

    [av_textblock size=” font_color=” color=”]

    Figure 2 - Law of Cosine
    Figure 2 – Law of Cosine

    [/av_textblock]

    [av_hr class=’invisible’ height=’20’ shadow=’no-shadow’ position=’center’ custom_border=’av-border-thin’ custom_width=’50px’ custom_border_color=” custom_margin_top=’30px’ custom_margin_bottom=’30px’ icon_select=’yes’ custom_icon_color=” icon=’ue808′ font=’entypo-fontello’]

    [av_textblock size=” font_color=” color=”]
    From the equations above, we were able to determine the distance d and the angle θ based on the readings of the sensors and the distance between them.  After finding these values, we were able to create two PI controllers: the vertical speed will be controlled by the error in d, and the horizontal speed will be controlled by the error in θ.  The vertical speed will tell us how fast to move forward while the horizontal speed will give us the difference in speed between the two motors.  Because we should follow BiPed within a distance of 20 inches or 50 centimeters with a 15% margin of error, we chose the tracking distance to be 18 inches or 45 centimeters which creates a 10% margin.  The reason we chose to follow BiPed at 18 inches is because from our blog post on the updated sensor’s field of view test (link to Updated MaxSonar Field of View Test), we determined that we were able to get better horizontal resolution the closer we were to BiPed.  Thus, our set point for the controller involving distance d is 45 centimeters.  Next, our set point for the angle θ is 90° or 1.57 radians.  The reason why we need the angle to be 90° is because we want the object to be perpendicular to the midpoint between both sensors.  This will make sure both the sensors are aligned and will straighten out the front of Goliath to face BiPed head on.  
    [/av_textblock]

    [av_heading tag=’h2′ padding=’10’ heading=’Fixed Errors Caused by Triangulation ‘ color=’custom-color-heading’ style=” custom_font=’#ff6a00′ size=” subheading_active=” subheading_size=’15’ custom_class=”][/av_heading]

    [av_textblock size=” font_color=” color=”]
    Initially, when we wrote the first algorithm, we noticed many errors where the values of theta and d returns nan or not a number.  The reason we are getting this error is because sometimes the sensors’ values do not create a perfect triangle.  This is caused by the object tracked because it is not perfectly a point in the sensor’s field of view.  Instead, the object has legs so when the sensors see the object, it will detect the closest part of the object.  For example, the left sensor will detect the left leg of BiPed while the right Sensor will detect the right leg of BiPed.  This will give us an inaccurate triangle and we will not be able to determine the distance nor the angle.  
    [/av_textblock]

    [av_hr class=’invisible’ height=’20’ shadow=’no-shadow’ position=’center’ custom_border=’av-border-thin’ custom_width=’50px’ custom_border_color=” custom_margin_top=’30px’ custom_margin_bottom=’30px’ icon_select=’yes’ custom_icon_color=” icon=’ue808′ font=’entypo-fontello’]

    [av_textblock size=” font_color=” color=”]
    In order to fix this error, we know that a triangle can only be formed by having the sum of the 2 greater sides being greater than the longest side [2].  Therefore, we have to find a solution to solve this problem shown in Figure 3.  
    [/av_textblock]

    [av_hr class=’invisible’ height=’20’ shadow=’no-shadow’ position=’center’ custom_border=’av-border-thin’ custom_width=’50px’ custom_border_color=” custom_margin_top=’30px’ custom_margin_bottom=’30px’ icon_select=’yes’ custom_icon_color=” icon=’ue808′ font=’entypo-fontello’]

    [av_textblock size=” font_color=” color=”]
    figure-3-calculation-solution

    Figure 3 - Calculating Fixed Error
    Figure 3 – Calculating Fixed Error

    [/av_textblock]

    [av_heading tag=’h2′ padding=’10’ heading=’Using RGB LEDs to Help Troubleshoot’ color=’custom-color-heading’ style=” custom_font=’#ff6a00′ size=” subheading_active=” subheading_size=’15’ custom_class=”][/av_heading]

    [av_textblock size=” font_color=” color=”]
    In order to fine tune the kp and ki constants for both the vertical and horizontal controllers, the five RGB LEDs were used to troubleshoot errors and overshoot caused by the controllers.  These LEDs performed perfectly in letting us know what Goliath is seeing as it is moved using the controlled algorithm.  Thus, we were able to adjust different parameters to make a perfect control system to track an object accurately.
    [/av_textblock]

    [av_heading tag=’h2′ padding=’10’ heading=’Writing the Triangulation Control Algorithm’ color=’custom-color-heading’ style=” custom_font=’#ff6a00′ size=” subheading_active=” subheading_size=’15’ custom_class=”][/av_heading]

    [av_textblock size=” font_color=” color=”]
    //store the sensors values into variables a and b

    double a = leftSensorAverage;

    double b = rightSensorAverage;

    //c represents the half the distance between both sensors

    double c = 9.375;

    //Fix the Distances if There is an Error in Creating a Triangle

    if (a>b) {

     b = adjust(a,b);}

     else {

     a = adjust(b,a);}

    //determining the direction the object is at

    double horizontalDirection = a-b;

    //using triangulation to find distance d and theta angle

    //please refer to Control Algorithm Using Triangulation

    //on Goliath Blog Posts for More Information

    double angleD = acos((sq(a)-sq(b)+(sq(2*c)))/(4*a*c));

    double d = sqrt(sq(a)+sq(c)-(2*a*c*cos(angleD)));

    double theta = asin(a/d*sin(angleD));

    //Initialize the set point of the vertical distance to be 45cm

    int dT = 45;

    //Find the Vertical Error

    int verticalError = dT – d;

    //Set an initial speed where motors are barely going forward

    int minVerticalSpeed = 140;

    /*//////////////////////////////////////

    *PI Contrller For Verical Control/////

    */////////////////////////////////////

    //Setting Up the P Controller

    int kpVertical = 0.7;

    float PVertical = abs(kpVertical*verticalError);

    //Setting Up the I Controller

    int kiVertical = 1;

    //If the vertcal distance d is closer to the set point make

    //integral term equal to 0 otherwise increase the integral term

    if (abs(verticalError)> 5){

     verticalIntegral = verticalIntegral+abs(verticalError);

    }

    else {

     verticalIntegral = 0;

    }

    int IVertical = abs(verticalIntegral*kiVertical);

    //Set the Vertical Speed to the sum of the output from the PI Controller

    float verticalSpeed = minVerticalSpeed+PVertical+IVertical;

    //Make the horizontal set point equal to 1.5708

    double horizontalError = 1.5708-theta;

    //Set an initial speed to differentiate between the motors speed

    int minHorizontalSpeed = 20;

    /*//////////////////////////////////////

    *PI Contrller For Horizontal Control///

    */////////////////////////////////////

    //Setting Up the P Controller

    int kpHorizontal = 50;

    float PHorizontal = abs(kpHorizontal*horizontalError);

    //Setting Up the I Controller

    int kiHorizontal = 10;

    //If the horizontal angle is closer to the set point make

    //integral term equal to 0 otherwise increase the integral term

    if (abs(horizontalError)> .4){

     horizontalIntegral = horizontalIntegral+abs(horizontalError);

    }

    else {

     horizontalIntegral = 0;

    }

    int IHorizontal = abs(horizontalIntegral*kiHorizontal);

    //Set the Horizontal Speed to the sum of the output from the PI Controller

    float horizontalSpeed = minHorizontalSpeed+PHorizontal+IHorizontal;

    //If the Object is further than the set point and it’s located

    //to the right make the left motor run faster than the right motor

    //to make a left turn going forward

    if ((verticalError<0)&&(horizontalDirection>0)){

      speedLeft = verticalSpeed + horizontalSpeed;

      speedRight = verticalSpeed – horizontalSpeed;

     }

     //If the object is further than the set point and it’s located

     //to the left make the right motor run faster than the left motor

     //to make a right turn going forward

     else if ((verticalError<0)&&(horizontalDirection<0)) {

      speedLeft = verticalSpeed – horizontalSpeed;

      speedRight = verticalSpeed + horizontalSpeed;

     }  

     //If the object is further than the set point and it’s located

     //in the middle make both motors run faster going forward

     else if ((verticalError<0)&&(horizontalDirection==0)) {

      speedLeft = verticalSpeed+horizontalSpeed;

      speedRight = verticalSpeed+horizontalSpeed;

     }

     //If the object is closer than the set point and it’s located

     //to the right make the left motor slower than the right motor

     //to make a right turn going backwards

     else if ((verticalError>0)&&(horizontalDirection>0)) {

      speedLeft = verticalSpeed – horizontalSpeed;

      speedRight = verticalSpeed + horizontalSpeed;

     }

     //if the object is closer than the set point and it’s located

     //to the left make the right motor slower than the left motor

     //to make a left turn going backwards

     else if ((verticalError>0)&&(horizontalDirection<0)) {

      speedLeft = verticalSpeed + horizontalSpeed;

      speedRight = verticalSpeed – horizontalSpeed;

     }

     //if the object is closer than the set point and it’s located

     //in the middle make both sensors run faster going backwards

     else if ((verticalError>0)&&(horizontalDirection==0)) {

       speedLeft = verticalSpeed + horizontalSpeed;

       speedRight = verticalSpeed + horizontalSpeed;

     }

     //if the object reaches the set point, don’t move the motors

     else if (verticalError==0) {

       speedLeft = 0;

       speedRight = 0;

     }

    //control the speed of the PWM to be within 0 to 255

    if (speedLeft >255) {

       speedLeft = 255;

    }

    else if (speedLeft < 0) {

       speedLeft = 0;

    }

    if (speedRight >255) {

       speedRight = 255;

    }

    else if (speedRight < 0) {

       speedRight = 0;

    }

    //If the object is on the right and it is below

    //the range of the set point adjust the brightness

    //of the two right red LEDs

    if ((a>b)&&(d<42)) {

     brightness = map(d,20,42,10,500);

      //LED1 Furthest Right LED

     pwmSensors.setPWM(12,0,brightness);

     pwmSensors.setPWM(13,0,0);

     pwmSensors.setPWM(11,0,0);

     //LED2

     pwmSensors.setPWM(9,0,brightness);

     pwmSensors.setPWM(10,0,0);

     pwmSensors.setPWM(8,0,0);

     //LED3

     pwmSensors.setPWM(6,0,0);

     pwmSensors.setPWM(7,0,0);

     pwmSensors.setPWM(5,0,0);

     //LED4

     pwmSensors.setPWM(3,0,0);

     pwmSensors.setPWM(4,0,0);

     pwmSensors.setPWM(2,0,0);

     //LED5 Furthest Left LED

     pwmSensors.setPWM(0,0,0);

     pwmSensors.setPWM(1,0,0);

     pwmSensors.setPWM(14,0,0);

    }

    //If the object is on the right and it is within

    //the range of the set point adjust the brightness

    //of the two right green LEDs

    else if ((a>b)&&((d>=42) && (d<=48))) {

    brightness = map(d,42,48,10,500);

      //LED1 Furthest Right LED

     pwmSensors.setPWM(12,0,0);

     pwmSensors.setPWM(13,0,brightness);

     pwmSensors.setPWM(11,0,0);

     //LED2

     pwmSensors.setPWM(9,0,0);

     pwmSensors.setPWM(10,0,brightness);

     pwmSensors.setPWM(8,0,0);

     //LED3

     pwmSensors.setPWM(6,0,0);

     pwmSensors.setPWM(7,0,0);

     pwmSensors.setPWM(5,0,0);

     //LED4

     pwmSensors.setPWM(3,0,0);

     pwmSensors.setPWM(4,0,0);

     pwmSensors.setPWM(2,0,0);

     //LED5 Furthest Left LED

     pwmSensors.setPWM(0,0,0);

     pwmSensors.setPWM(1,0,0);

     pwmSensors.setPWM(14,0,0);

    }

    //If the object is on the right and it is above the

    //range of the set point adjust the brightness of

    //the two right blue LEDs

    else if ((a>b)&&(d>48)) {

     brightness = map(d,48,255,10,4095);

      //LED1 Furthest Right LED

     pwmSensors.setPWM(12,0,0);

     pwmSensors.setPWM(13,0,0);

     pwmSensors.setPWM(11,0,brightness);

     //LED2

     pwmSensors.setPWM(9,0,0);

     pwmSensors.setPWM(10,0,0);

     pwmSensors.setPWM(8,0,brightness);

     //LED3

     pwmSensors.setPWM(6,0,0);

     pwmSensors.setPWM(7,0,0);

     pwmSensors.setPWM(5,0,0);

     //LED4

     pwmSensors.setPWM(3,0,0);

     pwmSensors.setPWM(4,0,0);

     pwmSensors.setPWM(2,0,0);

     //LED5 Furthest Left LED

     pwmSensors.setPWM(0,0,0);

     pwmSensors.setPWM(1,0,0);

     pwmSensors.setPWM(14,0,0);

    }

    //If the object is on the left and it is below

    //the range of the set point adjust the brightness

    //of the two left red LEDs

    else if ((a<b)&&(d<42)) {

    brightness = map(d,20,42,10,500);

      //LED1 Furthest Right LED

     pwmSensors.setPWM(12,0,0);

     pwmSensors.setPWM(13,0,0);

     pwmSensors.setPWM(11,0,0);

     //LED2

     pwmSensors.setPWM(9,0,0);

     pwmSensors.setPWM(10,0,0);

     pwmSensors.setPWM(8,0,0);

     //LED3

     pwmSensors.setPWM(6,0,0);

     pwmSensors.setPWM(7,0,0);

     pwmSensors.setPWM(5,0,0);

     //LED4

     pwmSensors.setPWM(3,0,brightness);

     pwmSensors.setPWM(4,0,0);

     pwmSensors.setPWM(2,0,0);

     //LED5 Furthest Left LED

     pwmSensors.setPWM(0,0,brightness);

     pwmSensors.setPWM(1,0,0);

     pwmSensors.setPWM(14,0,0);

    }

    //If the object is on the left and it is within

    //the range of the set point adjust the brightness

    //of the two left green LEDs

    else if ((a<b)&&((d>=42) && (d<=48))){

    brightness = map(d,42,48,10,500);

      //LED1 Furthest Right LED

     pwmSensors.setPWM(12,0,0);

     pwmSensors.setPWM(13,0,0);

     pwmSensors.setPWM(11,0,0);

     //LED2

     pwmSensors.setPWM(9,0,0);

     pwmSensors.setPWM(10,0,0);

     pwmSensors.setPWM(8,0,0);

     //LED3

     pwmSensors.setPWM(6,0,0);

     pwmSensors.setPWM(7,0,0);

     pwmSensors.setPWM(5,0,0);

     //LED4

     pwmSensors.setPWM(3,0,0);

     pwmSensors.setPWM(4,0,brightness);

     pwmSensors.setPWM(2,0,0);

     //LED5 Furthest Left LED

     pwmSensors.setPWM(0,0,0);

     pwmSensors.setPWM(1,0,brightness);

     pwmSensors.setPWM(14,0,0);

    }

    //If the object is on the left and it is above the

    //range of the set point adjust the brightness of

    //the two left blue LEDs

    else if ((a<b)&&(d>48)){

    brightness = map(d,48,255,10,4095);

      //LED1 Furthest Right LED

     pwmSensors.setPWM(12,0,0);

     pwmSensors.setPWM(13,0,0);

     pwmSensors.setPWM(11,0,0);

     //LED2

     pwmSensors.setPWM(9,0,0);

     pwmSensors.setPWM(10,0,0);

     pwmSensors.setPWM(8,0,0);

     //LED3

     pwmSensors.setPWM(6,0,0);

     pwmSensors.setPWM(7,0,0);

     pwmSensors.setPWM(5,0,0);

     //LED4

     pwmSensors.setPWM(3,0,0);

     pwmSensors.setPWM(4,0,0);

     pwmSensors.setPWM(2,0,brightness);

     //LED5 Furthest Left LED

     pwmSensors.setPWM(0,0,0);

     pwmSensors.setPWM(1,0,0);

     pwmSensors.setPWM(14,0,brightness);

    }

    //If the object is in the middle and it is below the

    //range of the set point adjust the brightness of

    //the three middle red LEDs

    else if ((a==b)&&(d<42)) {

    brightness = map(d,20,42,10,500);

      //LED1 Furthest Right LED

     pwmSensors.setPWM(12,0,0);

     pwmSensors.setPWM(13,0,0);

     pwmSensors.setPWM(11,0,0);

     //LED2

     pwmSensors.setPWM(9,0,brightness);

     pwmSensors.setPWM(10,0,0);

     pwmSensors.setPWM(8,0,0);

     //LED3

     pwmSensors.setPWM(6,0,brightness);

     pwmSensors.setPWM(7,0,0);

     pwmSensors.setPWM(5,0,0);

     //LED4

     pwmSensors.setPWM(3,0,brightness);

     pwmSensors.setPWM(4,0,0);

     pwmSensors.setPWM(2,0,0);

     //LED5 Furthest Left LED

     pwmSensors.setPWM(0,0,0);

     pwmSensors.setPWM(1,0,0);

     pwmSensors.setPWM(14,0,0);

    }

    //If the object is in the middle and it is within the

    //range of the set point adjust the brightness of

    //the three middle green LEDs

    else if ((a==b)&&((d>=42) && (d<=48))){

    brightness = map(d,42,48,10,500);

      //LED1 Furthest Right LED

     pwmSensors.setPWM(12,0,0);

     pwmSensors.setPWM(13,0,0);

     pwmSensors.setPWM(11,0,0);

     //LED2

     pwmSensors.setPWM(9,0,0);

     pwmSensors.setPWM(10,0,brightness);

     pwmSensors.setPWM(8,0,0);

     //LED3

     pwmSensors.setPWM(6,0,0);

     pwmSensors.setPWM(7,0,brightness);

     pwmSensors.setPWM(5,0,0);

     //LED4

     pwmSensors.setPWM(3,0,0);

     pwmSensors.setPWM(4,0,brightness);

     pwmSensors.setPWM(2,0,0);

     //LED5 Furthest Left LED

     pwmSensors.setPWM(0,0,0);

     pwmSensors.setPWM(1,0,0);

     pwmSensors.setPWM(14,0,0);

    }

    //If the object is in the middle and it is above the

    //range of the set point adjust the brightness of

    //the three middle blue LEDs

    else if ((a==b)&&(d>48)){

    brightness = map(d,48,255,10,4095);

      //LED1 Furthest Right LED

     pwmSensors.setPWM(12,0,0);

     pwmSensors.setPWM(13,0,0);

     pwmSensors.setPWM(11,0,0);

     //LED2

     pwmSensors.setPWM(9,0,0);

     pwmSensors.setPWM(10,0,0);

     pwmSensors.setPWM(8,0,brightness);

     //LED3

     pwmSensors.setPWM(6,0,0);

     pwmSensors.setPWM(7,0,0);

     pwmSensors.setPWM(5,0,brightness);

     //LED4

     pwmSensors.setPWM(3,0,0);

     pwmSensors.setPWM(4,0,0);

     pwmSensors.setPWM(2,0,brightness);

     //LED5 Furthest Left LED

     pwmSensors.setPWM(0,0,0);

     pwmSensors.setPWM(1,0,0);

     pwmSensors.setPWM(14,0,0);

    }

    //If the difference between both LEDs is

    //greater than 15, we are lost so turn on

    //all red LEDs

    if (abs(a-b)>15){

      //LED1 Furthest Right LED

     pwmSensors.setPWM(12,0,500);

     pwmSensors.setPWM(13,0,0);

     pwmSensors.setPWM(11,0,0);

     //LED2

     pwmSensors.setPWM(9,0,500);

     pwmSensors.setPWM(10,0,0);

     pwmSensors.setPWM(8,0,0);

     //LED3

     pwmSensors.setPWM(6,0,500);

     pwmSensors.setPWM(7,0,0);

     pwmSensors.setPWM(5,0,0);

     //LED4

     pwmSensors.setPWM(3,0,500);

     pwmSensors.setPWM(4,0,0);

     pwmSensors.setPWM(2,0,0);

     //LED5 Furthest Left LED

     pwmSensors.setPWM(0,0,500);

     pwmSensors.setPWM(1,0,0);

     pwmSensors.setPWM(14,0,0);

    }

    //If the object is too close

    //from set point go backwards

    if (verticalError>0){

     motorA.go(2,speedLeft);

     motorB.go(2,speedRight);

    }

    //If the object is too far

    //from set point go forwards

    else if (verticalError<0) {

     motorA.go(1,speedLeft);

     motorB.go(1,speedRight);

    }

    //if the object is within range

    //of set point stop moving

    else if (verticalError==0) {

     motorA.go(1,0);

     motorB.go(1,0);

    }

    //fix the shorter side if a triangle

    //is not able to be formed

    float adjust(float Sl,float Ss)

    {

     float c = 18.75;

     if (Sl >= (Ss+c)){

     float extra = Sl-(Ss+c)+1;

     Ss = Ss+extra;}

     return Ss;

    }
    [/av_textblock]

    [av_hr class=’invisible’ height=’20’ shadow=’no-shadow’ position=’center’ custom_border=’av-border-thin’ custom_width=’50px’ custom_border_color=” custom_margin_top=’30px’ custom_margin_bottom=’30px’ icon_select=’yes’ custom_icon_color=” icon=’ue808′ font=’entypo-fontello’]

    [av_textblock size=” font_color=” color=”]

    Figure 4 - Tracking Biped from the Middle
    Figure 4 – Tracking Biped from the Middle

    [/av_textblock]

    [av_hr class=’invisible’ height=’20’ shadow=’no-shadow’ position=’center’ custom_border=’av-border-thin’ custom_width=’50px’ custom_border_color=” custom_margin_top=’30px’ custom_margin_bottom=’30px’ icon_select=’yes’ custom_icon_color=” icon=’ue808′ font=’entypo-fontello’]

    [av_textblock size=” font_color=” color=”]

    Figure 5 - Tracking Biped from the Right
    Figure 5 – Tracking Biped from the Right

    [/av_textblock]

    [av_hr class=’invisible’ height=’20’ shadow=’no-shadow’ position=’center’ custom_border=’av-border-thin’ custom_width=’50px’ custom_border_color=” custom_margin_top=’30px’ custom_margin_bottom=’30px’ icon_select=’yes’ custom_icon_color=” icon=’ue808′ font=’entypo-fontello’]

    [av_textblock size=” font_color=” color=”]

    Figure 6 - Tracking Biped from the Left
    Figure 6 – Tracking Biped from the Left

    [/av_textblock]

    [av_heading tag=’h2′ padding=’10’ heading=’Conclusion’ color=’custom-color-heading’ style=” custom_font=’#ff6a00′ size=” subheading_active=” subheading_size=’15’ custom_class=”][/av_heading]

    [av_textblock size=” font_color=” color=”]
    From our tests in developing the control algorithm, we were able to fine tune the two PI controllers by choosing these settings:

    Vertical PI Controller: Minimum Speed = 140, kp = 0.7, ki = 1

    Horizontal PI Controller: Minimum Speed = 20, kp = 50, ki = 10

    As a result, Goliath was able to track an object at a distance of 18 inches accurately and it stayed within the range of 20 inches with a 10% margin of error.  There were no jitters caused in the constant changes of the motor’s values and the motors ran smoothly as it tracked the object.  Also, Goliath was able to move backwards and set itself within the designated set point.  This algorithm proved that using triangulation was an effective way to implement an autonomous system with the MaxSonar sensors.  Furthermore, this algorithm will be able to assist future developers and robot enthusiasts in their projects involving control systems for autonomous vehicles and robotic systems.
    [/av_textblock]

    [av_hr class=’invisible’ height=’20’ shadow=’no-shadow’ position=’center’ custom_border=’av-border-thin’ custom_width=’50px’ custom_border_color=” custom_margin_top=’30px’ custom_margin_bottom=’30px’ icon_select=’yes’ custom_icon_color=” icon=’ue808′ font=’entypo-fontello’]

    [av_textblock size=” font_color=’custom’ color=’#ff6a00′]
    Source Material

    1. http://mathworld.wolfram.com/LawofCosines.html
    2. http://www.virtualnerd.com/geometry/triangle-relationships/inequalities-one-triangle/side-lengths-valid-example

    [/av_textblock]

    [/av_one_full]

  • Updated MaxSonar Field of View and Resolution Test

    Updated MaxSonar Field of View and Resolution Test

    [av_one_full first min_height=” vertical_alignment=” space=” custom_margin=” margin=’0px’ padding=’0px’ border=” border_color=” radius=’0px’ background_color=” src=” background_position=’top left’ background_repeat=’no-repeat’ animation=”]
    [av_textblock size=’25’ font_color=” color=”]
    Goliath Fall 2016
    [/av_textblock]

    [av_hr class=’invisible’ height=’-50′ shadow=’no-shadow’ position=’center’ custom_border=’av-border-thin’ custom_width=’50px’ custom_border_color=” custom_margin_top=’30px’ custom_margin_bottom=’30px’ icon_select=’yes’ custom_icon_color=” icon=’ue808′ font=’entypo-fontello’]

    [av_textblock size=’25’ font_color=” color=”]
    Updated MaxSonar Field of View and Resolution Test
    [/av_textblock]
    [/av_one_full]

    [av_hr class=’invisible’ height=’-60′ shadow=’no-shadow’ position=’center’ custom_border=’av-border-thin’ custom_width=’50px’ custom_border_color=” custom_margin_top=’30px’ custom_margin_bottom=’30px’ icon_select=’yes’ custom_icon_color=” icon=’ue808′ font=’entypo-fontello’]

    [av_textblock size=” font_color=’custom’ color=’#bfbfbf’]
    By: Sou Thao (Electronics and Control Engineer)

    Approved by Kristen Oduca (Project Manager)
    [/av_textblock]

    [av_three_fourth first min_height=” vertical_alignment=” space=” custom_margin=” margin=’0px’ padding=’0px’ border=” border_color=” radius=’0px’ background_color=” src=” background_position=’top left’ background_repeat=’no-repeat’ animation=”]
    [av_textblock size=’16’ font_color=’custom’ color=’#6b6b6b’]

    [/av_textblock]
    [/av_three_fourth]

    [av_one_full first min_height=” vertical_alignment=” space=” custom_margin=” margin=’0px’ padding=’0px’ border=” border_color=” radius=’0px’ background_color=” src=” background_position=’top left’ background_repeat=’no-repeat’ animation=”]

    [av_heading tag=’h2′ padding=’10’ heading=’Introduction’ color=’custom-color-heading’ style=” custom_font=’#ff6a00′ size=” subheading_active=” subheading_size=’15’ custom_class=”][/av_heading]

    [av_textblock size=” font_color=” color=”]
    Requirements

    • The Goliath shall follow the BiPed at a distance of 20 inches with 15% margin of error. 
    • Goliath should use triangulation to find the location of the Biped.

    In order to create an effective control algorithm and to make Goliath run autonomously, we needed to understand the MaxSonar Sensor’s Field of View.  The field of view is what the sensors are able to see, and its resolution represents how it is able to differentiate an object’s position as the object moves.  To determine the boundaries of the sensor’s field of view, we can create graphs and plot an object’s position as it moves around the sensors.  Thus, we will be able to determine the sensor’s resolution along the x and y axis and its boundaries, which will help us in developing our code.
    [/av_textblock]

    [av_heading tag=’h2′ padding=’10’ heading=’Experiments’ color=’custom-color-heading’ style=” custom_font=’#ff6a00′ size=” subheading_active=” subheading_size=’15’ custom_class=”][/av_heading]

    [av_textblock size=” font_color=” color=”]
    To perform the experiments for determining the sensor’s field of view, we followed the procedures RiGonz used to determine the field of view for the HC-SR04 ultrasonic sensors [1]First, we needed to graph each sensor and determine the boundary points where the object is no longer detected.  To set up the experiment, we taped graph papers together and labeled our graphs by inches and feet shown in Figure 1.
    [/av_textblock]

    [av_hr class=’invisible’ height=’20’ shadow=’no-shadow’ position=’center’ custom_border=’av-border-thin’ custom_width=’50px’ custom_border_color=” custom_margin_top=’30px’ custom_margin_bottom=’30px’ icon_select=’yes’ custom_icon_color=” icon=’ue808′ font=’entypo-fontello’]

    [av_textblock size=” font_color=” color=”]

    Figure 1 - Labeled Graph Set Up
    Figure 1 – Labeled Graph Set Up

    [/av_textblock]

    [av_hr class=’invisible’ height=’20’ shadow=’no-shadow’ position=’center’ custom_border=’av-border-thin’ custom_width=’50px’ custom_border_color=” custom_margin_top=’30px’ custom_margin_bottom=’30px’ icon_select=’yes’ custom_icon_color=” icon=’ue808′ font=’entypo-fontello’]

    [av_textblock size=” font_color=” color=”]
    Next we taped our sensor to the end of one side of the graph and moved a 5 inch cylinder, the size of BiPed, around the sensor.  We noted where the sensor is not able able to detect the object, and moved the object around the left side of the sensor and continued onto the right side shown in Figure 2 and 3.
    [/av_textblock]

    [av_hr class=’invisible’ height=’20’ shadow=’no-shadow’ position=’center’ custom_border=’av-border-thin’ custom_width=’50px’ custom_border_color=” custom_margin_top=’30px’ custom_margin_bottom=’30px’ icon_select=’yes’ custom_icon_color=” icon=’ue808′ font=’entypo-fontello’]

    [av_textblock size=” font_color=” color=”]

    Figure 2 - Graphing Sensors X-Axis
    Figure 2 – Graphing Sensors X-Axis

    [/av_textblock]

    [av_hr class=’invisible’ height=’20’ shadow=’no-shadow’ position=’center’ custom_border=’av-border-thin’ custom_width=’50px’ custom_border_color=” custom_margin_top=’30px’ custom_margin_bottom=’30px’ icon_select=’yes’ custom_icon_color=” icon=’ue808′ font=’entypo-fontello’]

    [av_textblock size=” font_color=” color=”]

    Figure 3 - Graph of Sensor's View of Biped X-Axis
    Figure 3 – Graph of Sensor’s View of Biped X-Axis

    [/av_textblock]

    [av_hr class=’invisible’ height=’20’ shadow=’no-shadow’ position=’center’ custom_border=’av-border-thin’ custom_width=’50px’ custom_border_color=” custom_margin_top=’30px’ custom_margin_bottom=’30px’ icon_select=’yes’ custom_icon_color=” icon=’ue808′ font=’entypo-fontello’]

    [av_textblock size=” font_color=” color=”]
    After we were able to determine the boundaries of the sensor, we needed to graph the sensor’s resolution along the y axis.  As we placed an object in front of the sensor, we slowly moved the object forward and noted where the sensor’s value changed.  Then we physically measured the change noted on the graph which yield a vertical resolution of about 1cm shown in orange in Figure 4.
    [/av_textblock]

    [av_hr class=’invisible’ height=’20’ shadow=’no-shadow’ position=’center’ custom_border=’av-border-thin’ custom_width=’50px’ custom_border_color=” custom_margin_top=’30px’ custom_margin_bottom=’30px’ icon_select=’yes’ custom_icon_color=” icon=’ue808′ font=’entypo-fontello’]

    [av_textblock size=” font_color=” color=”]

    Figure 4 - Graphing Sensor's View Y-Axis
    Figure 4 – Graphing Sensor’s View Y-Axis

    [/av_textblock]

    [av_hr class=’invisible’ height=’20’ shadow=’no-shadow’ position=’center’ custom_border=’av-border-thin’ custom_width=’50px’ custom_border_color=” custom_margin_top=’30px’ custom_margin_bottom=’30px’ icon_select=’yes’ custom_icon_color=” icon=’ue808′ font=’entypo-fontello’]

    [av_textblock size=” font_color=” color=”]
    In turn, this represents that the sensor is able to determine if an object has moved along the vertical axis if it is 1cm or farther away.  After performing these tests with one of the sensors, we performed these same tests with the other sensor, which gave us the same results.  Thus we were able to verify that both sensors worked and performed in a similar fashion shown.
    [/av_textblock]

    [av_hr class=’invisible’ height=’20’ shadow=’no-shadow’ position=’center’ custom_border=’av-border-thin’ custom_width=’50px’ custom_border_color=” custom_margin_top=’30px’ custom_margin_bottom=’30px’ icon_select=’yes’ custom_icon_color=” icon=’ue808′ font=’entypo-fontello’]

    [av_textblock size=” font_color=” color=”]

    The next test we conducted were putting both sensors together and plotting the crossing 
    boundaries and measuring its resolution along the x and y axis. We first created a platform to place our sensors at a fixed angle of 15 degrees and separated by a distance of 4.5 inches from each other shown in Figure 5.

    [/av_textblock]

    [av_hr class=’invisible’ height=’20’ shadow=’no-shadow’ position=’center’ custom_border=’av-border-thin’ custom_width=’50px’ custom_border_color=” custom_margin_top=’30px’ custom_margin_bottom=’30px’ icon_select=’yes’ custom_icon_color=” icon=’ue808′ font=’entypo-fontello’]

    [av_textblock size=” font_color=” color=”]

    Figure 5 - Setting Up to Graph Cross Boundaries
    Figure 5 – Setting Up to Graph Cross Boundaries

    [/av_textblock]

    [av_hr class=’invisible’ height=’20’ shadow=’no-shadow’ position=’center’ custom_border=’av-border-thin’ custom_width=’50px’ custom_border_color=” custom_margin_top=’30px’ custom_margin_bottom=’30px’ icon_select=’yes’ custom_icon_color=” icon=’ue808′ font=’entypo-fontello’]

    [av_textblock size=” font_color=” color=”]
    Next we created the same graph as we did in the first experiment and plotted the boundaries of the cross region from both sensors.  In order to plot these boundaries, we moved the object until one sensor is out of view while the other one still sees the object.  Therefore, by doing this experiment, we created the boundaries where both sensors crossed shown in Figure 6 as the black cylinders.  By looking at figure, an object should be within the black cylinders in order for both sensors to detect the object.
    [/av_textblock]

    [av_hr class=’invisible’ height=’20’ shadow=’no-shadow’ position=’center’ custom_border=’av-border-thin’ custom_width=’50px’ custom_border_color=” custom_margin_top=’30px’ custom_margin_bottom=’30px’ icon_select=’yes’ custom_icon_color=” icon=’ue808′ font=’entypo-fontello’]

    [av_textblock size=” font_color=” color=”]

    Figure 6 - Graph of Cross Boundaries
    Figure 6 – Graph of Cross Boundaries

    [/av_textblock]

    [av_hr class=’invisible’ height=’20’ shadow=’no-shadow’ position=’center’ custom_border=’av-border-thin’ custom_width=’50px’ custom_border_color=” custom_margin_top=’30px’ custom_margin_bottom=’30px’ icon_select=’yes’ custom_icon_color=” icon=’ue808′ font=’entypo-fontello’]

    [av_textblock size=” font_color=” color=”]
    Next we determined the vertical resolution along the y axis similar to the first experiment which yield a resolution of 1cm.  Last but not least, we needed to determine the horizontal resolution along the x axis.  In order to do this, we marked the horizontal line in orange where 20inches was located in front of the sensors shown in Figure 6.  Then as we moved the object across this 20 inches line, we marked where the values of the sensor changes.  From the values we determined the horizontal resolution across the readings was very close to 3.  Although we can distinguish between 10 readings, these readings came from different combinations of the sensor’s value between 49, 50, and 51 at 20 inches or 50cms away. 
    [/av_textblock]

    [av_heading tag=’h2′ padding=’10’ heading=’Determining if BiPed Can Be Tracked Within Range of 20 Inches’ color=’custom-color-heading’ style=” custom_font=’#ff6a00′ size=” subheading_active=” subheading_size=’15’ custom_class=”][/av_heading]

    [av_textblock size=” font_color=” color=”]
    In order to see if our sensors will be able to track BiPed at a distance close to 20 inches away, we have to determine where both sensors’ field of view crosses, which will give us the minimum distance we can follow BiPed.  Because the sensor’s field of view is about 30 degrees according to the previous blog post, if we angled the sensors by an extra 15 degrees, we would have something similar to the diagram on Figure 7 [2].  
    [/av_textblock]

    [av_hr class=’invisible’ height=’20’ shadow=’no-shadow’ position=’center’ custom_border=’av-border-thin’ custom_width=’50px’ custom_border_color=” custom_margin_top=’30px’ custom_margin_bottom=’30px’ icon_select=’yes’ custom_icon_color=” icon=’ue808′ font=’entypo-fontello’]

    [av_textblock size=” font_color=” color=”]

    Figure 7 - Diagram of Angling Sensors an Extra 15 Degrees
    Figure 7 – Diagram of Angling Sensors an Extra 15 Degrees

    [/av_textblock]

    [av_hr class=’invisible’ height=’20’ shadow=’no-shadow’ position=’center’ custom_border=’av-border-thin’ custom_width=’50px’ custom_border_color=” custom_margin_top=’30px’ custom_margin_bottom=’30px’ icon_select=’yes’ custom_icon_color=” icon=’ue808′ font=’entypo-fontello’]

    [av_textblock size=” font_color=” color=”]
    Each sensor is located on the bottom left and right corners and they are angled to the right or left.  The variable ds represents the distance between the sensors, yx represents the distance where the sensors cross, yf represents the distance from the sensors where the full coverage is achieved, and xf represents the full coverage across the sensors at the vertical point where there is full coverage.  Given the diagram, we can find the lengths of the sides given the distance between the sensors, thus we can find the cross distance yx to determine if we can track BiPed.  To find yx shown in Figure 8 and 9:
    [/av_textblock]

    [av_hr class=’invisible’ height=’20’ shadow=’no-shadow’ position=’center’ custom_border=’av-border-thin’ custom_width=’50px’ custom_border_color=” custom_margin_top=’30px’ custom_margin_bottom=’30px’ icon_select=’yes’ custom_icon_color=” icon=’ue808′ font=’entypo-fontello’]

    [av_textblock size=” font_color=” color=”]

    Figure 8- Right Sensor Calculating xf, yf
    Figure 8- Right Sensor Calculating xf, yf

    [/av_textblock]

    [av_hr class=’invisible’ height=’20’ shadow=’no-shadow’ position=’center’ custom_border=’av-border-thin’ custom_width=’50px’ custom_border_color=” custom_margin_top=’30px’ custom_margin_bottom=’30px’ icon_select=’yes’ custom_icon_color=” icon=’ue808′ font=’entypo-fontello’]

    [av_textblock size=” font_color=” color=”]

    Figure 9 - Left Sensor Calculating yx
    Figure 9 – Left Sensor Calculating yx

     
    [/av_textblock]

    [av_hr class=’invisible’ height=’20’ shadow=’no-shadow’ position=’center’ custom_border=’av-border-thin’ custom_width=’50px’ custom_border_color=” custom_margin_top=’30px’ custom_margin_bottom=’30px’ icon_select=’yes’ custom_icon_color=” icon=’ue808′ font=’entypo-fontello’]

    [av_textblock size=” font_color=” color=”]
    From the results, we can see that the sensors cross at 6.5 inches and the crossing region maximizes after 13 inches.  Therefore, we will be able to track BiPed within the range of 20 inches.
    [/av_textblock]

    [av_heading tag=’h2′ padding=’10’ heading=’Determining the Number of Unique Horizontal Readings ‘ color=’custom-color-heading’ style=” custom_font=’#ff6a00′ size=” subheading_active=” subheading_size=’15’ custom_class=”][/av_heading]

    [av_textblock size=” font_color=” color=”]
    The number of unique horizontal readings the sensors is able to detect is important because it tells us how many points the sensor will be able to detect as an object moves across the x axis.  To calculate this, we first draw a diagram to to show what one sensor is seeing, in our case, the right sensor is drawn in Figure 10.
    [/av_textblock]

    [av_hr class=’invisible’ height=’20’ shadow=’no-shadow’ position=’center’ custom_border=’av-border-thin’ custom_width=’50px’ custom_border_color=” custom_margin_top=’30px’ custom_margin_bottom=’30px’ icon_select=’yes’ custom_icon_color=” icon=’ue808′ font=’entypo-fontello’]

    [av_textblock size=” font_color=” color=”]

    Figure 10 - Calculating What the Right Sensor Views
    Figure 10 – Calculating What the Right Sensor Views

    [/av_textblock]

    [av_hr class=’invisible’ height=’20’ shadow=’no-shadow’ position=’center’ custom_border=’av-border-thin’ custom_width=’50px’ custom_border_color=” custom_margin_top=’30px’ custom_margin_bottom=’30px’ icon_select=’yes’ custom_icon_color=” icon=’ue808′ font=’entypo-fontello’]

    [av_textblock size=” font_color=” color=”]
    From the figure, xr represents the horizontal resolution, yr represents the y vertical resolution, and y represents the straight length if the object is placed directly in front of the sensor.  To determine the horizontal resolution, we need to find xr to find unique readings shown in Figure 11.  
    [/av_textblock]

    [av_hr class=’invisible’ height=’20’ shadow=’no-shadow’ position=’center’ custom_border=’av-border-thin’ custom_width=’50px’ custom_border_color=” custom_margin_top=’30px’ custom_margin_bottom=’30px’ icon_select=’yes’ custom_icon_color=” icon=’ue808′ font=’entypo-fontello’]

    [av_textblock size=” font_color=” color=”]

    Figure 11 - Calculating the Amount of Unique Readings
    Figure 11 – Calculating the Amount of Unique Readings

    [/av_textblock]

    [av_hr class=’invisible’ height=’20’ shadow=’no-shadow’ position=’center’ custom_border=’av-border-thin’ custom_width=’50px’ custom_border_color=” custom_margin_top=’30px’ custom_margin_bottom=’30px’ icon_select=’yes’ custom_icon_color=” icon=’ue808′ font=’entypo-fontello’]

    [av_textblock size=” font_color=” color=”]
    From the calculations, we can see that the number of unique readings the sensor can detect an object moving along the horizontal axis is about 2.  In other words, the farther away an object is from the sensor, the less x axis resolution there will be.  So in our case, it would be ideal to track BiPed from a closer distance than 20 inches.  Figure 12 illustrates the resolution as the object moves across the horizontal axis.  The x value represents the distance the object is away from the sensor and the y axis represents the number of unique readings the object is able to detect at the distance the object is away from the sensor.  As a result, we can see that the closer an object is to the sensor, the better the sensor is able to detect an object move across the x-axis.
    [/av_textblock]

    [av_hr class=’invisible’ height=’20’ shadow=’no-shadow’ position=’center’ custom_border=’av-border-thin’ custom_width=’50px’ custom_border_color=” custom_margin_top=’30px’ custom_margin_bottom=’30px’ icon_select=’yes’ custom_icon_color=” icon=’ue808′ font=’entypo-fontello’]

    [av_textblock size=” font_color=” color=”]

    Figure 12 - Resolution of Object Across X-Axis
    Figure 12 – Resolution of Object Across X-Axis

    [/av_textblock]

    [av_heading tag=’h2′ padding=’10’ heading=’Conclusion’ color=’custom-color-heading’ style=” custom_font=’#ff6a00′ size=” subheading_active=” subheading_size=’15’ custom_class=”][/av_heading]

    [av_textblock size=” font_color=” color=”]
    From the different experiments conducted, we determined that the sensors are able to track BiPed from a range of 20 inches.  If BiPed can be tracked closer, the sensors will be able to detect better movements.  Also, the sensors will have to be angled about 15 degrees to make their 30 degree field of view face each other to provide the best range for tracking.  This experiment will be able to move the design forward in helping to develop a more sophisticated control algorithm.  Thus, we can be able to follow BiPed autonomously at a fixed range close to 20 inches.
    [/av_textblock]

    [av_hr class=’invisible’ height=’20’ shadow=’no-shadow’ position=’center’ custom_border=’av-border-thin’ custom_width=’50px’ custom_border_color=” custom_margin_top=’30px’ custom_margin_bottom=’30px’ icon_select=’yes’ custom_icon_color=” icon=’ue808′ font=’entypo-fontello’]

    [av_textblock size=” font_color=’custom’ color=’#ff6a00′]
    Source Material

    1. https://forum.arduino.cc/index.php?topic=243076.0
    2. http://arxterra.com/control-algorithm/

    [/av_textblock]

    [/av_one_full]

  • Torque Calculation for Going Up a Ramp

    Torque Calculation for Going Up a Ramp

    [av_one_full first min_height=” vertical_alignment=” space=” custom_margin=” margin=’0px’ padding=’0px’ border=” border_color=” radius=’0px’ background_color=” src=” background_position=’top left’ background_repeat=’no-repeat’ animation=”]

    [av_textblock size=’25’ font_color=” color=”]
    Goliath Fall 2016
    [/av_textblock]

    [av_hr class=’invisible’ height=’-50′ shadow=’no-shadow’ position=’center’ custom_border=’av-border-thin’ custom_width=’50px’ custom_border_color=” custom_margin_top=’30px’ custom_margin_bottom=’30px’ icon_select=’yes’ custom_icon_color=” icon=’ue808′ font=’entypo-fontello’]

    [av_textblock size=’25’ font_color=” color=”]
    Torque Calculation for Going Up a Ramp
    [/av_textblock]

    [/av_one_full][av_hr class=’invisible’ height=’-60′ shadow=’no-shadow’ position=’center’ custom_border=’av-border-thin’ custom_width=’50px’ custom_border_color=” custom_margin_top=’30px’ custom_margin_bottom=’30px’ icon_select=’yes’ custom_icon_color=” icon=’ue808′ font=’entypo-fontello’]

    [av_three_fourth first min_height=” vertical_alignment=” space=” custom_margin=” margin=’0px’ padding=’0px’ border=” border_color=” radius=’0px’ background_color=” src=” background_position=’top left’ background_repeat=’no-repeat’ animation=”]
    [av_textblock size=’16’ font_color=’custom’ color=’#6b6b6b’]

    [/av_textblock]
    [/av_three_fourth]

    [av_textblock size=” font_color=’custom’ color=’#bfbfbf’]
    By: Diana Nguyen (Missions, Systems, and Test Engineer)

    Approved by Kristen Oduca (Project Manager)
    [/av_textblock]

    [av_one_full first min_height=” vertical_alignment=” space=” custom_margin=” margin=’0px’ padding=’0px’ border=” border_color=” radius=’0px’ background_color=” src=” background_position=’top left’ background_repeat=’no-repeat’ animation=”]

    [av_heading tag=’h2′ padding=’10’ heading=’Introuction’ color=’custom-color-heading’ style=” custom_font=’#ff6a00′ size=” subheading_active=” subheading_size=’15’ custom_class=”][/av_heading]

    [av_textblock size=” font_color=” color=”]
    Requirement: To drive the Goliath up the 6 degree incline, the motor shall provide a minimum torque of 0.0249 Nm.

    For the Save the Human Game, there will be two ramps in the course of the game.  Both ramps will have a 6.5° incline, plateaus and then decline 6.5°.  Goliath will need to be able follow the biped up the ramp and across it.
    [/av_textblock]

    [av_heading heading=’Calculations’ tag=’h2′ style=” size=” subheading_active=” subheading_size=’15’ padding=’10’ color=’custom-color-heading’ custom_font=’#ff6a00′][/av_heading]

    [av_textblock size=” font_color=” color=”]
    Goliath needs to be able to go up a ramp with an incline of 6.5°.  The mass of Goliath is 350 g or 0.35 kg and the static coefficient of friction for rubber and cardboard is between 0.5-0.8 [1]. We need to be able to produce enough force to be able to move the Goliath up the ramp which would be Fmove.
    [/av_textblock]

    [av_hr class=’invisible’ height=’20’ shadow=’no-shadow’ position=’center’ custom_border=’av-border-thin’ custom_width=’50px’ custom_border_color=” custom_margin_top=’30px’ custom_margin_bottom=’30px’ icon_select=’yes’ custom_icon_color=” icon=’ue808′ font=’entypo-fontello’]

    [av_textblock size=” font_color=” color=”]

    Figure 1 - Fmove Equation
    Figure 1 – Fmove Equation

    [/av_textblock]

    [av_hr class=’invisible’ height=’20’ shadow=’no-shadow’ position=’center’ custom_border=’av-border-thin’ custom_width=’50px’ custom_border_color=” custom_margin_top=’30px’ custom_margin_bottom=’30px’ icon_select=’yes’ custom_icon_color=” icon=’ue808′ font=’entypo-fontello’]

    [av_textblock size=” font_color=” color=”]
    From Figure 1 we can see that FN is the opposite force of -mgcosθ. Therefore we can assume FN = -(-mgcosθ).
    [/av_textblock]

    [av_hr class=’invisible’ height=’20’ shadow=’no-shadow’ position=’center’ custom_border=’av-border-thin’ custom_width=’50px’ custom_border_color=” custom_margin_top=’30px’ custom_margin_bottom=’30px’ icon_select=’yes’ custom_icon_color=” icon=’ue808′ font=’entypo-fontello’]

    [av_textblock size=” font_color=” color=”]

    Figure 2 - FN Equation
    Figure 2 – FN Equation

    [/av_textblock]

    [av_hr class=’invisible’ height=’20’ shadow=’no-shadow’ position=’center’ custom_border=’av-border-thin’ custom_width=’50px’ custom_border_color=” custom_margin_top=’30px’ custom_margin_bottom=’30px’ icon_select=’yes’ custom_icon_color=” icon=’ue808′ font=’entypo-fontello’]

    [av_textblock size=” font_color=” color=”]
    Since we now have FN and we know µs ,which is the the static friction.  We can complete our calculation of Fmove.
    [/av_textblock]

    [av_hr class=’invisible’ height=’20’ shadow=’no-shadow’ position=’center’ custom_border=’av-border-thin’ custom_width=’50px’ custom_border_color=” custom_margin_top=’30px’ custom_margin_bottom=’30px’ icon_select=’yes’ custom_icon_color=” icon=’ue808′ font=’entypo-fontello’]

    [av_textblock size=” font_color=” color=”]

    Figure 3 - Calculating Fmove
    Figure 3 – Calculating Fmove

    [/av_textblock]

    [av_hr class=’invisible’ height=’20’ shadow=’no-shadow’ position=’center’ custom_border=’av-border-thin’ custom_width=’50px’ custom_border_color=” custom_margin_top=’30px’ custom_margin_bottom=’30px’ icon_select=’yes’ custom_icon_color=” icon=’ue808′ font=’entypo-fontello’]

    [av_textblock size=” font_color=” color=”]
    Using this we can now calculate the amount of torque the motors need to produce.  Torque can be calculated from Torque = (Radius of shaft)  * Fmove.
    [/av_textblock]

    [av_hr class=’invisible’ height=’20’ shadow=’no-shadow’ position=’center’ custom_border=’av-border-thin’ custom_width=’50px’ custom_border_color=” custom_margin_top=’30px’ custom_margin_bottom=’30px’ icon_select=’yes’ custom_icon_color=” icon=’ue808′ font=’entypo-fontello’]

    [av_textblock size=” font_color=” color=”]
    Figure 5 shows the diagram of the forces.
    [/av_textblock]

    [av_hr class=’invisible’ height=’20’ shadow=’no-shadow’ position=’center’ custom_border=’av-border-thin’ custom_width=’50px’ custom_border_color=” custom_margin_top=’30px’ custom_margin_bottom=’30px’ icon_select=’yes’ custom_icon_color=” icon=’ue808′ font=’entypo-fontello’]

    [av_textblock size=” font_color=” color=”]

    Figure 5 - Diagram of Forces on a Ramp
    Figure 5 – Diagram of Forces on a Ramp

    [/av_textblock]

    [av_heading tag=’h2′ padding=’10’ heading=’Conclusion’ color=’custom-color-heading’ style=” custom_font=’#ff6a00′ size=” subheading_active=” subheading_size=’15’ custom_class=”][/av_heading]

    [av_textblock size=” font_color=” color=”]
    Base off these calculations we can conclude that based off our current model Goliath we need a motor with a minimum torque of 0.0528 Nm.  After our motor test we can see if the motors we purchased be able to produce this minimum amount required to go up the ramp.
    [/av_textblock]

    [av_hr class=’invisible’ height=’20’ shadow=’no-shadow’ position=’center’ custom_border=’av-border-thin’ custom_width=’50px’ custom_border_color=” custom_margin_top=’30px’ custom_margin_bottom=’30px’ icon_select=’yes’ custom_icon_color=” icon=’ue808′ font=’entypo-fontello’]

    [av_textblock size=” font_color=’custom’ color=’#ff6a00′]
    Source Material

    1. http://www.engineeringtoolbox.com/friction-coefficients-d_778.html

    [/av_textblock]

    [/av_one_full]

  • Post CDR Redesign

    Post CDR Redesign

    [av_one_full first min_height=” vertical_alignment=” space=” custom_margin=” margin=’0px’ padding=’0px’ border=” border_color=” radius=’0px’ background_color=” src=” background_position=’top left’ background_repeat=’no-repeat’ animation=”]

    [av_textblock size=’25’ font_color=” color=”]
    Goliath Fall 2016
    [/av_textblock]

    [av_hr class=’invisible’ height=’-50′ shadow=’no-shadow’ position=’center’ custom_border=’av-border-thin’ custom_width=’50px’ custom_border_color=” custom_margin_top=’30px’ custom_margin_bottom=’30px’ icon_select=’yes’ custom_icon_color=” icon=’ue808′ font=’entypo-fontello’]

    [av_textblock size=’25’ font_color=” color=”]
    Post CDR Redesign
    [/av_textblock]

    [/av_one_full][av_hr class=’invisible’ height=’-60′ shadow=’no-shadow’ position=’center’ custom_border=’av-border-thin’ custom_width=’50px’ custom_border_color=” custom_margin_top=’30px’ custom_margin_bottom=’30px’ icon_select=’yes’ custom_icon_color=” icon=’ue808′ font=’entypo-fontello’]

    [av_textblock size=” font_color=’custom’ color=’#bfbfbf’]
    By: Dylan Hong (Design and Manufacturing Engineer)

    Approved by Kristen Oduca (Project Manager)
    [/av_textblock]

    [av_three_fourth first min_height=” vertical_alignment=” space=” custom_margin=” margin=’0px’ padding=’0px’ border=” border_color=” radius=’0px’ background_color=” src=” background_position=’top left’ background_repeat=’no-repeat’ animation=”]
    [av_textblock size=’16’ font_color=’custom’ color=’#6b6b6b’]

    [/av_textblock]
    [/av_three_fourth]

    [av_one_full first min_height=” vertical_alignment=” space=” custom_margin=” margin=’0px’ padding=’0px’ border=” border_color=” radius=’0px’ background_color=” src=” background_position=’top left’ background_repeat=’no-repeat’ animation=”]

    [av_heading tag=’h2′ padding=’10’ heading=’Introuction’ color=’custom-color-heading’ style=” custom_font=’#ff6a00′ size=” subheading_active=” subheading_size=’15’ custom_class=”][/av_heading]

    [av_textblock size=” font_color=” color=”]
    Requirement: The Goliath shall be a scale model of the Goliath 302 tank.

    After the CDR presentation, we were able to implement our design with software and hardware integration. We combined the 3D printed model with the electronic components such as the motors, sensors, and breadboard to test out its functionalities. After testing, we realized that the design from CDR had to change in order to have the Goliath be more practical. The concerns when testing our model was that the suspension-like wheels that we printed for CDR was not sturdy enough and easy to assemble. Also, the smaller wheels were too thin and could not support the Goliath as a whole. Furthermore, while the brass hinges worked well, the customer did not like the appearance of it with the Goliath and desired that we make the sensor doors and top-bottom panel door incorporate its own plastic hinges.
    [/av_textblock]

    [av_heading heading=’Post CDR Redesign’ tag=’h2′ style=” size=” subheading_active=” subheading_size=’15’ padding=’10’ color=’custom-color-heading’ custom_font=’#ff6a00′][/av_heading]

    [av_textblock size=” font_color=” color=”]
    Since the small wheels were fragile and too difficult to assemble, we decided to make the wheel holders a part of the side panel instead of its own separate part. Originally, we planned on having the wheel holders carry two small wheels, but printing such small parts were not pratical. To make it thicker, we designed the wheel holder to look like caster wheels, which will hold a single small wheel instead of two. We also changed the dimensions of the small wheels from 2mm to 4mm so that we would have a better fit onto the tracks shown in Figure 1.
    [/av_textblock]

    [av_hr class=’invisible’ height=’20’ shadow=’no-shadow’ position=’center’ custom_border=’av-border-thin’ custom_width=’50px’ custom_border_color=” custom_margin_top=’30px’ custom_margin_bottom=’30px’ icon_select=’yes’ custom_icon_color=” icon=’ue808′ font=’entypo-fontello’]

    [av_textblock size=” font_color=” color=”]

    Figure 1 - Wheel Holder
    Figure 1 – Wheel Holder

    [/av_textblock]

    [av_hr class=’invisible’ height=’20’ shadow=’no-shadow’ position=’center’ custom_border=’av-border-thin’ custom_width=’50px’ custom_border_color=” custom_margin_top=’30px’ custom_margin_bottom=’30px’ icon_select=’yes’ custom_icon_color=” icon=’ue808′ font=’entypo-fontello’]

    [av_textblock size=” font_color=” color=”]
    As for the hinges, we incorporated a plastic snap on hinge for the top-bottom panels and sensor doors to eliminate the appearance of the brass and to make the Goliath use less hardware fasteners such as screws and nuts shown in Figure 2 and 3.
    [/av_textblock]

    [av_hr class=’invisible’ height=’20’ shadow=’no-shadow’ position=’center’ custom_border=’av-border-thin’ custom_width=’50px’ custom_border_color=” custom_margin_top=’30px’ custom_margin_bottom=’30px’ icon_select=’yes’ custom_icon_color=” icon=’ue808′ font=’entypo-fontello’]

    [av_textblock size=” font_color=” color=”]

    Figure 2 - Sensor Fastener
    Figure 2 – Sensor Fastener

    [/av_textblock]

    [av_hr class=’invisible’ height=’20’ shadow=’no-shadow’ position=’center’ custom_border=’av-border-thin’ custom_width=’50px’ custom_border_color=” custom_margin_top=’30px’ custom_margin_bottom=’30px’ icon_select=’yes’ custom_icon_color=” icon=’ue808′ font=’entypo-fontello’]

    [av_textblock size=” font_color=” color=”]

    Figure 3 - Top and Bottom Panel Fastener
    Figure 3 – Top and Bottom Panel Fastener

    [/av_textblock]

    [av_hr class=’invisible’ height=’20’ shadow=’no-shadow’ position=’center’ custom_border=’av-border-thin’ custom_width=’50px’ custom_border_color=” custom_margin_top=’30px’ custom_margin_bottom=’30px’ icon_select=’yes’ custom_icon_color=” icon=’ue808′ font=’entypo-fontello’]

    [av_textblock size=” font_color=” color=”]
    Also, since the PCB will be mounted underneath the top panel, we made cut outs of the SMD LEDs and trimmpot so that the LEDs can be visible to the audience and so the speaker volume can be adjustable shown in Figure 4.
    [/av_textblock]

    [av_hr class=’invisible’ height=’20’ shadow=’no-shadow’ position=’center’ custom_border=’av-border-thin’ custom_width=’50px’ custom_border_color=” custom_margin_top=’30px’ custom_margin_bottom=’30px’ icon_select=’yes’ custom_icon_color=” icon=’ue808′ font=’entypo-fontello’]

    [av_textblock size=” font_color=” color=”]

    Figure 4 - SMD LEDs and Trim-mpot Cut Out
    Figure 4 – SMD LEDs and Trim-mpot Cut Out

    [/av_textblock]

    [av_hr class=’invisible’ height=’20’ shadow=’no-shadow’ position=’center’ custom_border=’av-border-thin’ custom_width=’50px’ custom_border_color=” custom_margin_top=’30px’ custom_margin_bottom=’30px’ icon_select=’yes’ custom_icon_color=” icon=’ue808′ font=’entypo-fontello’]

    [av_textblock size=” font_color=” color=”]
    Other details have been added for cosmetic purposes that relate to the 302 Goliath such as the screw holes for the side panel, the rear bar bumper and the pointed handle on the front of the Goliath shown in Figure 5.
    [/av_textblock]

    [av_hr class=’invisible’ height=’20’ shadow=’no-shadow’ position=’center’ custom_border=’av-border-thin’ custom_width=’50px’ custom_border_color=” custom_margin_top=’30px’ custom_margin_bottom=’30px’ icon_select=’yes’ custom_icon_color=” icon=’ue808′ font=’entypo-fontello’]

    [av_textblock size=” font_color=” color=”]

    Figure 5 - Screw Holes
    Figure 5 – Screw Holes

    [/av_textblock]

    [av_hr class=’invisible’ height=’20’ shadow=’no-shadow’ position=’center’ custom_border=’av-border-thin’ custom_width=’50px’ custom_border_color=” custom_margin_top=’30px’ custom_margin_bottom=’30px’ icon_select=’yes’ custom_icon_color=” icon=’ue808′ font=’entypo-fontello’]

    [av_textblock size=” font_color=” color=”]
    Note that the details on the top panel such as screw holes were removed due to it interfering with the attachment of the suction cup, which is used to hold the LG G2 on top of the Goliath.
    [/av_textblock]

    [av_heading tag=’h2′ padding=’10’ heading=’Conclusion’ color=’custom-color-heading’ style=” custom_font=’#ff6a00′ size=” subheading_active=” subheading_size=’15’ custom_class=”][/av_heading]

    [av_textblock size=” font_color=” color=”]
    Overall, these little tweaks to the design were needed to fix the functionality of the wheels and tracks when in motion. The PCB cut out were also needed to display the distance and direction of the Bidped to the user and the audiences. The other minor changes were mainly cosmetic tweaks that linked to the requirement of making the model look as much as the 302 Goliath.
    [/av_textblock]

    [/av_one_full]

  • Custom Telemetry

    Custom Telemetry

    [av_one_full first min_height=” vertical_alignment=” space=” custom_margin=” margin=’0px’ padding=’0px’ border=” border_color=” radius=’0px’ background_color=” src=” background_position=’top left’ background_repeat=’no-repeat’ animation=”]

    [av_textblock size=’25’ font_color=” color=”]
    Goliath Fall 2016
    [/av_textblock]

    [av_hr class=’invisible’ height=’-50′ shadow=’no-shadow’ position=’center’ custom_border=’av-border-thin’ custom_width=’50px’ custom_border_color=” custom_margin_top=’30px’ custom_margin_bottom=’30px’ icon_select=’yes’ custom_icon_color=” icon=’ue808′ font=’entypo-fontello’]

    [av_textblock size=’25’ font_color=” color=”]
    Custom Telemetry
    [/av_textblock]

    [/av_one_full][av_hr class=’invisible’ height=’-60′ shadow=’no-shadow’ position=’center’ custom_border=’av-border-thin’ custom_width=’50px’ custom_border_color=” custom_margin_top=’30px’ custom_margin_bottom=’30px’ icon_select=’yes’ custom_icon_color=” icon=’ue808′ font=’entypo-fontello’]

    [av_three_fourth first min_height=” vertical_alignment=” space=” custom_margin=” margin=’0px’ padding=’0px’ border=” border_color=” radius=’0px’ background_color=” src=” background_position=’top left’ background_repeat=’no-repeat’ animation=”]
    [av_textblock size=’16’ font_color=’custom’ color=’#6b6b6b’]

    [/av_textblock]
    [/av_three_fourth]

    [av_textblock size=” font_color=’custom’ color=’#bfbfbf’]
    By: Diana Nguyen (Missions, Systems, and Test Engineer)

    Approved by Kristen Oduca (Project Manager)
    [/av_textblock]

    [av_one_full first min_height=” vertical_alignment=” space=” custom_margin=” margin=’0px’ padding=’0px’ border=” border_color=” radius=’0px’ background_color=” src=” background_position=’top left’ background_repeat=’no-repeat’ animation=”]

    [av_heading tag=’h2′ padding=’10’ heading=’Introuction’ color=’custom-color-heading’ style=” custom_font=’#ff6a00′ size=” subheading_active=” subheading_size=’15’ custom_class=”][/av_heading]

    [av_textblock size=” font_color=” color=”]
    Requirement: Goliath shall be Biped’s vision during the game shall be provided by the camera and periscope on the Goliath.

    For our custom command, we created remote button that appear on the Arxterra Control Panel and Arxterra App. These remote buttons allow us to switch between remote control mode and autonomous mode.  For telemetry we will be displaying the battery level of the 3Dot and phone.  It is important to know the difference between telemetry and commands.  Commands is when information is being sent to the robot while telemetry is information about the robot being sent to the user.  For example, commands would be the user sending the robot instruction where to move.  Telemetry would be the robot sending what its battery level to the user.
    [/av_textblock]

    [av_heading heading=’Set up’ tag=’h2′ style=” size=” subheading_active=” subheading_size=’15’ padding=’10’ color=’custom-color-heading’ custom_font=’#ff6a00′][/av_heading]

    [av_heading heading=’Custom Commands’ tag=’h3′ style=” size=” subheading_active=” subheading_size=’15’ padding=’10’ color=’custom-color-heading’ custom_font=’#ff6a00′][/av_heading]

    [av_textblock size=” font_color=” color=”]
    Custom commands can be set up on the Arxterra App in developer mode which can be accessed on the main menu.  Once developer mode is on, click on the gear icon next to the on and off switch of developer mode shown in Figure 1.
    [/av_textblock]

    [av_hr class=’invisible’ height=’20’ shadow=’no-shadow’ position=’center’ custom_border=’av-border-thin’ custom_width=’50px’ custom_border_color=” custom_margin_top=’30px’ custom_margin_bottom=’30px’ icon_select=’yes’ custom_icon_color=” icon=’ue808′ font=’entypo-fontello’]

    [av_textblock size=” font_color=” color=”]

    Figure 1 - Developer Mode on and Gear Icon
    Figure 1 – Developer Mode on and Gear Icon

    [/av_textblock]

    [av_hr class=’invisible’ height=’20’ shadow=’no-shadow’ position=’center’ custom_border=’av-border-thin’ custom_width=’50px’ custom_border_color=” custom_margin_top=’30px’ custom_margin_bottom=’30px’ icon_select=’yes’ custom_icon_color=” icon=’ue808′ font=’entypo-fontello’]

    [av_textblock size=” font_color=” color=”]
    From the new drop down menu, click on “Custom Command & Telemetry Configuration” shown in Figure 2.
    [/av_textblock]

    [av_hr class=’invisible’ height=’20’ shadow=’no-shadow’ position=’center’ custom_border=’av-border-thin’ custom_width=’50px’ custom_border_color=” custom_margin_top=’30px’ custom_margin_bottom=’30px’ icon_select=’yes’ custom_icon_color=” icon=’ue808′ font=’entypo-fontello’]

    [av_textblock size=” font_color=” color=”]

    Figure 2 - Drop Down Menu
    Figure 2 – Drop Down Menu

    [/av_textblock]

    [av_hr class=’invisible’ height=’20’ shadow=’no-shadow’ position=’center’ custom_border=’av-border-thin’ custom_width=’50px’ custom_border_color=” custom_margin_top=’30px’ custom_margin_bottom=’30px’ icon_select=’yes’ custom_icon_color=” icon=’ue808′ font=’entypo-fontello’]

    [av_textblock size=” font_color=” color=”]
    Here you can create as many custom command as you need as long as you have available registers.  You can create a new custom command by clicking the “+” and select what kind of switch you want shown in Figure 3.  
    [/av_textblock]

    [av_hr class=’invisible’ height=’20’ shadow=’no-shadow’ position=’center’ custom_border=’av-border-thin’ custom_width=’50px’ custom_border_color=” custom_margin_top=’30px’ custom_margin_bottom=’30px’ icon_select=’yes’ custom_icon_color=” icon=’ue808′ font=’entypo-fontello’]

    [av_textblock size=” font_color=” color=”]

    Figure 3 - Adding Custom Commands
    Figure 3 – Adding Custom Commands

    [/av_textblock]

    [av_hr class=’invisible’ height=’20’ shadow=’no-shadow’ position=’center’ custom_border=’av-border-thin’ custom_width=’50px’ custom_border_color=” custom_margin_top=’30px’ custom_margin_bottom=’30px’ icon_select=’yes’ custom_icon_color=” icon=’ue808′ font=’entypo-fontello’]

    [av_textblock size=” font_color=” color=”]
    We decide to use remote buttons with the option of “Remote Control” or “Autonomous”.  As shown in the picture above RC mode is command 0x00 and autonomous is 0x01.  Both in the code and application RC mode is set to the default method of control for Goliath.
    [/av_textblock]

    [av_heading heading=’Telemetry’ tag=’h3′ style=” size=” subheading_active=” subheading_size=’15’ padding=’10’ color=’custom-color-heading’ custom_font=’#ff6a00′][/av_heading]

    [av_textblock size=” font_color=” color=”]
    Below in Figures 4 and 5 is photos of the Goliath telemetry and custom command code.  Everything in a red box is custom command and blue boxes is telemetry.
    [/av_textblock]

    [av_hr class=’invisible’ height=’20’ shadow=’no-shadow’ position=’center’ custom_border=’av-border-thin’ custom_width=’50px’ custom_border_color=” custom_margin_top=’30px’ custom_margin_bottom=’30px’ icon_select=’yes’ custom_icon_color=” icon=’ue808′ font=’entypo-fontello’]

    [av_textblock size=” font_color=” color=”]

    Figure 4 - Custom Command and Telemetry Code Part 1
    Figure 4 – Custom Command and Telemetry Code Part 1

    [/av_textblock]

    [av_hr class=’invisible’ height=’20’ shadow=’no-shadow’ position=’center’ custom_border=’av-border-thin’ custom_width=’50px’ custom_border_color=” custom_margin_top=’30px’ custom_margin_bottom=’30px’ icon_select=’yes’ custom_icon_color=” icon=’ue808′ font=’entypo-fontello’]

    [av_textblock size=” font_color=” color=”]

    Figure 4 - Custom Commands and Telemetry Code Part 2
    Figure 4 – Custom Commands and Telemetry Code Part 2

    [/av_textblock]

    [av_heading tag=’h2′ padding=’10’ heading=’Conclusion’ color=’custom-color-heading’ style=” custom_font=’#ff6a00′ size=” subheading_active=” subheading_size=’15’ custom_class=”][/av_heading]

    [av_textblock size=” font_color=” color=”]
    After reading this blog post you have a slightly better understanding of commands and telemetry.  One of the main things to note is the difference between them.  Commands is information being sent to the robot while telemetry is information about the robot being sent to the user.
    [/av_textblock]

    [/av_one_full]