Written by Zachary de Bruyn
Purpose
The purpose of this testing is to determine the amount of current the motors draw when supplies with a CR123 – 3.7 V battery. The motors were inserted into the “3DoT Chassis” and to simulate the amount of current the motors draw when supplied with a load; in this case the weight of the chassis, running at 3.7 V.
Test Set-Up
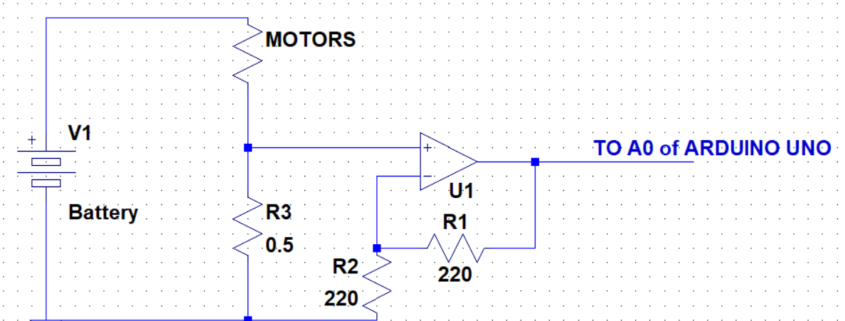
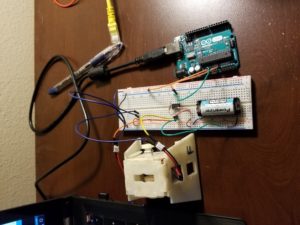
The test utilized was performed using the Arduino Uno and a voltmeter for redundancy. The setup is displayed below in figure 1. The two GM6 DC motors were inserted into the 3DoT chassis, as shown in the figures at the end of this blog. The chassis was then anchored by string to a desk to prevent it from moving while conducting the tests.

The motor load shown in figure 1 consists of two motors in parallel with a shunt resistor, R3, connected to the non-inverting input of an LM731 opamp The goal of this schematic was to drive a voltage gain at the output of the opamp that could then later be used to accurately measure the current draw of the two dc motors.
Going over some basic opamp characteristics:
- For ideal opamp the input resistance is infinite to both the inverting and noninverting inputs.
- The inverting opamp inputs drive each other to be equal, therefore:

- For the inverting setup as displayed in figure 1, the gain is given as:

By recalling the three basics of the opamp listed above, we can then accurately measure the voltage (vin) that is measured across the 0.5-Ohm wire resistor. At the output of the opamp, a wire was connected to the A0 pin of the Arduino Uno. The 5-V supplied by the Arduino acted as the rail for the opamp and the CR123 battery was used as the dc input to power the load (motors). The following code was then uploaded through the Arduino IDE which allowed us to use the ADC from he A0 pin to measure the voltage at the output in 1s intervals.
/* Voltage Meter code Original source credit to https://www.allaboutcircuits.com/projects/make-a-
digital-voltmeter-using-the-arduino/

Modified for uses with RC123 Battery by Zach de Bruyn CSULB EE400D*/

const float referenceVolts = 5; // The measurement of your battery
const int batteryPin = A0; // battery is connected to analog pin 0

void setup()
{
Serial.begin(9600);
}

void loop()
{
int val = analogRead(batteryPin); // read the value from the sensor
float volts = (val / 1024.0) * referenceVolts; // calculate the ratio
Serial.println(volts); // print the value in volts
delay(1000);
}
A voltmeter was used to measure the voltage over the small resistance wire as a form of redundancy and accuracy checking of the Arduino code. The experimental measurement of the wire resistor was 0.5-Ohms.
Test and Results
The voltage was read from the Arduino serial monitor which averaged at 2.46-V. This is the “vout” from the gain equation earlier. The overall gain of the system was 2, where the resistors of equal value added to the 1 of the equation. Solving for vin, we find that the vin value is 1.23-V.
Recalling the three basic opamp rules earlier, we know that the infinite input resistances of the opamp causes no current to flow through the inputs, instead, all current goes through the 0.5-Ohm shunt resistor. Because the inputs drive each other to equal zero, the shunt resistor essentially acts as a voltage divider for the circuit. Therefore, the vin calculated, is the voltage over the shunt resistor. Performing Ohm’s law, we find that the current through the load is 2.46-A, where the current is assumed to be evenly split between the two motors in parallel, implying that each motor draws 1.23-A of current.
The voltages collected from the Arduino were then gathered into Matlab and analyzed through the following code:
clear all, clc
V_m = [ % Values collected from Serial Monitor];

x = smooth(V_m, 0.3, 'loess');

plot(V_m/0.5, '.b'); grid on;
hold on
plot(x/0.5, '.r', 'linewidth', 1.5)
hold off
xlim([0, length(x)])
legend('Raw Data', 'Smooth')
xlabel('Time - sec'); ylabel('A');
title('Arduino measurements')
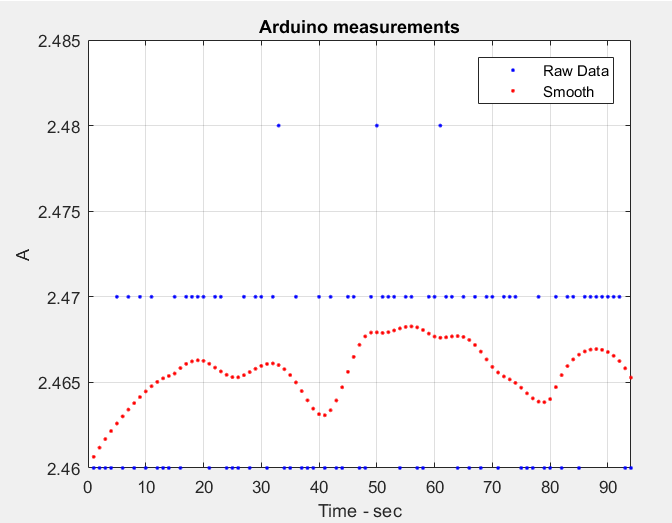
As we can see from the data points collected from the Matlab plot, the current fluctuated between 2.46 and 2.47 A, with an average being 2.46-A. The raw data collected every second is displayed in blue, while the averaging data is displayed in red.

Pictures of Physical Test Set-Up
Not shown are the wheels or string which suspended the movement of the chassis, however, the general understanding of the setup can be achieved with the following pictures.


