[av_hr class=’invisible’ height=’-60′ shadow=’no-shadow’ position=’center’ custom_border=’av-border-thin’ custom_width=’50px’ custom_border_color=” custom_margin_top=’30px’ custom_margin_bottom=’30px’ icon_select=’yes’ custom_icon_color=” icon=’ue808′ font=’entypo-fontello’]
[av_three_fourth first min_height=” vertical_alignment=” space=” custom_margin=” margin=’0px’ padding=’0px’ border=” border_color=” radius=’0px’ background_color=” src=” background_position=’top left’ background_repeat=’no-repeat’ animation=”]
[av_textblock size=’16’ font_color=’custom’ color=’#6b6b6b’]
[/av_textblock]
[/av_three_fourth]
[av_textblock size=” font_color=’custom’ color=’#bfbfbf’]
By: Sou Thao (Electronics and Control Engineer)
Approved by Kristen Oduca (Project Manager)
[/av_textblock]
[av_one_full first min_height=” vertical_alignment=” space=” custom_margin=” margin=’0px’ padding=’0px’ border=” border_color=” radius=’0px’ background_color=” src=” background_position=’top left’ background_repeat=’no-repeat’ animation=”]
[av_textblock size=’25’ font_color=” color=”]
Goliath Fall 2016
[/av_textblock]
[av_hr class=’invisible’ height=’-50′ shadow=’no-shadow’ position=’center’ custom_border=’av-border-thin’ custom_width=’50px’ custom_border_color=” custom_margin_top=’30px’ custom_margin_bottom=’30px’ icon_select=’yes’ custom_icon_color=” icon=’ue808′ font=’entypo-fontello’]
[av_textblock size=’25’ font_color=” color=”]
How to Graph In Arduino IDE
[/av_textblock]
[/av_one_full][av_one_full first min_height=” vertical_alignment=” space=” custom_margin=” margin=’0px’ padding=’0px’ border=” border_color=” radius=’0px’ background_color=” src=” background_position=’top left’ background_repeat=’no-repeat’ animation=”]
[av_heading tag=’h2′ padding=’10’ heading=’Introuction’ color=’custom-color-heading’ style=” custom_font=’#ff6a00′ size=” subheading_active=” subheading_size=’15’ custom_class=”][/av_heading]
[av_textblock size=” font_color=” color=”]
Requirement: Goliath should use triangulation to find the location of the Biped.
In order to troubleshoot errors caused in the code and the control algorithm, we needed to find a way to graph the sensors to determine what values they are seeing. To create these graphs, there are many programs that will enable a user to interface an Arduino board to their software including Matlab and Processing. By far the easiest and fastest way to create a graph is through using the newest feature in the Arduino IDE, the Serial Plotter. The Serial Plotter allows a user to graph a certain value in real time. Similar to how a user uses the Serial.print command to see the values in the Serial Monitor, the Serial Plotter uses the Serial.print command to plot the values in the Serial Plotter Window. Thus, one will be able to plot their sensor’s values or different datas with ease.
[/av_textblock]
[av_heading heading=’How to Graph Using the Serial Plotter’ tag=’h2′ style=” size=” subheading_active=” subheading_size=’15’ padding=’10’ color=’custom-color-heading’ custom_font=’#ff6a00′][/av_heading]
[av_textblock size=” font_color=” color=”]
By following the instructions stated from instructables to plot a single variable, a user must write the Serial.println(variableName) command [1]. Then under the Tools Menu on the top of the IDE, the user must select Serial Plotter and run their code after that. The program will automatically start plotting the variable in real time, and auto adjust the y-axis as the variable moves along. Sometimes, it will take the y-axis some time to self adjust because 500 points are plotted on the x axis. Therefore, a user will not be able to detect exactly where their values are, but they can get a good estimate. To plot more than one variable, a user starts with the Serial.print(variable) command. Then they must put a space in between the variables using either Serial.print(“ “) or Serial.print(“\t”). After that, the user ends the graphs with the last variable using the Serial.println(variable) command. Notice the “ln” at the end. The user must use this statement in order to be able to graph all the variables, otherwise, the Serial Plotter will not graph the sensors. As a result, we use these steps and were able to graph the sensors to help us troubleshoot the control algorithm.
[/av_textblock]
[av_heading heading=’Writing the Algorithm’ tag=’h2′ style=” size=” subheading_active=” subheading_size=’15’ padding=’10’ color=’custom-color-heading’ custom_font=’#ff6a00′][/av_heading]
[av_textblock size=” font_color=” color=”]
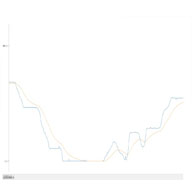
We wanted to graph the left and right sensor to determine what the sensors are seeing as an object is placed in front of it. Therefore, by running the extra code below to our original code and using the Serial Plotter, we were able to create a graph of our data. This helped us in fine tuning our code and adjust different parameters in the control algorithm. Also, it helped us to determine a good size for the running averaging filter so we can track an object effectively shown in Figure 1.
[/av_textblock]
[av_hr class=’invisible’ height=’20’ shadow=’no-shadow’ position=’center’ custom_border=’av-border-thin’ custom_width=’50px’ custom_border_color=” custom_margin_top=’30px’ custom_margin_bottom=’30px’ icon_select=’yes’ custom_icon_color=” icon=’ue808′ font=’entypo-fontello’]
[av_textblock size=” font_color=” color=”]

[/av_textblock]
[av_heading heading=’Conclusion’ tag=’h2′ style=” size=” subheading_active=” subheading_size=’15’ padding=’10’ color=’custom-color-heading’ custom_font=’#ff6a00′][/av_heading]
[av_textblock size=” font_color=” color=”]
By plotting our sensor values using the Arduino Serial Plotter, we were able to see what happens when we move an object in front of the sensor. The sensor value did not jump around as much because we had a running averaging filter on both sensors. With the help of the Serial Plotter, we were able to adjust our PI controller in our control algorithm to make Goliath follow BiPed accurately. Thus, any user is able to use this new feature on the Arduino IDE in order to quickly graph their data and see how their data is changing.
[/av_textblock]
[/av_one_full][av_hr class=’invisible’ height=’20’ shadow=’no-shadow’ position=’center’ custom_border=’av-border-thin’ custom_width=’50px’ custom_border_color=” custom_margin_top=’30px’ custom_margin_bottom=’30px’ icon_select=’yes’ custom_icon_color=” icon=’ue808′ font=’entypo-fontello’]
[av_textblock size=” font_color=’custom’ color=’#ff6a00′]
Source Material
[/av_textblock]