Written by Zachary de Bruyn
Purpose
The purpose of this experiment was to test the TCS34725 RBG Color-to-Digital sensor to determine if it was applicable for the purposes of the EE400D project “PeteBot”. The testing included testing of the sensitivity of the sensor, its ability to distinguish difference between colors, and performing studies as to the limitation of the sensor.
DC Characteristics of the TCS
The TCS operates at a nominal voltage of 3-V with a maximum being 3.6-V. Depending on the state of the device, the current drawn ranges from 235-uA in an active state down to 2.5-uA in a sleep state.
DC Characteristics at the board level
The board is designed for usage with the Arduino where the VIN input is designed for 5-V, and draws XXXX A current.
The TCS34725: The TCS34725 at the component level is the physical IC located on the breakout board that reads colors and digitizes them for the benefits of the user. Therefore when referring to the TCS34725, it is in reference to the actual IC, whereas when referring to the board, it is implied that we are talking about the entire board with all IC’s and passive components.
The TCS utilizes an I2C interface with a slave address as 0x29 in hexadecimal. Therefore in order to implement multiple TCS’ within the same I2C bus, certain precautions will need to be utilized, such as an I2C extender.
The block diagram of the TCS is shown below. From the diagram it can be seen that the light entering the sensor is filtered before going through four ADC afterwhich the signal is digitized into four different color data sections: Clear, Red, Blue, Green. The digitized data is then sent via I2C bus to the respective MCU being utilized; in this case the Arduino Uno.

Breakout Board: The schematic of the breakout board is provided below, and is courtesy of Adafruit.

As shown by the breakout board schematic, the board is powered by a 5-V input through the VIN pin on the board, and is then stepped down through an LDO (RT9193) to 3.3-V. The 5-V is also used for the source voltage for the two MOSFETs utilized in the circuit. The 3.3-V is then used as the gate voltage for the MOSFETs, and is also the input voltage necessary for the majority of the circuit including the TCS and LED MOSFET. The breakout board also utilizes this 3.3-V and provides a 3.3-V output through the board (via pin 3, ‘+3V3’).
Test Set-Up
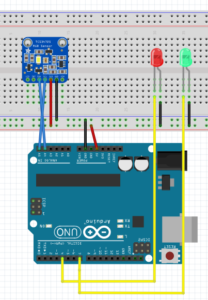
The purpose of this test was to determine the TCS’ ability to distinguish between colors. This test was performed by covering a square piece of cardboard with white tape, and then applying a half-inch strip of electrical tape down the center. The black tape is to simulate the lines of the maze, and the TCS’s ability to detect between colors. The basic test setup is given by Adafruit, where the VIN pin of the breakout board is powered via the 5-V of the Arduino, and the SDA and SCL inputs are connected to analog pins 4 and 5.

Next a circular wall was constructed to surround the breakout board so that testing can be done in a controlled environment which would mitigate the sensors ability to pick up any ambient light. This wall also allows us to maintain a static distance between the breakout board and the test strip that will be utilized to test the sensors ability to distinguish colors. Two LED’s were also utilized which would help determine if the correct value was being measured. When the correct color was measured (predetermined by me) the green LED would emit, else the red LED would light.
The code below was provided in the Adafruit library, and was modified in order to test the ability of the board to read colors.
/* Source provided by Adafruit and modified by Zach de Bruyn CSULB EE400D
   Connect SCL    to analog 5
   Connect SDA    to analog 4
   Connect VDD    to 5V DC
   Connect GROUND to common ground
 */

#include <Wire.h>
#include "Adafruit_TCS34725.h"

const int greenLED = 4;
const int redLED = 7;
const int fwd = 10;
const int rvs = 11;

/* Initialise with specific int time and gain values */
Adafruit_TCS34725 tcs = Adafruit_TCS34725(TCS34725_INTEGRATIONTIME_700MS, TCS34725_GAIN_1X);

void setup(void) {
  Serial.begin(9600);
  pinMode(greenLED, OUTPUT);
  pinMode(redLED, OUTPUT);

  if (tcs.begin()) {
    Serial.println("Found sensor");
  } else {
    Serial.println("No TCS34725 found ... check your connections");
    while (1);
  }

}

void loop(void) {
  readSensor();

 }

void readSensor (){
    uint16_t r, g, b, c, colorTemp, lux;

  tcs.getRawData(&r, &g, &b, &c);
  colorTemp = tcs.calculateColorTemperature(r, g, b);
  lux = tcs.calculateLux(r, g, b);

  Serial.print("Color Temp: "); Serial.print(colorTemp, DEC); Serial.print(" K - ");
  Serial.print("Lux: "); Serial.print(lux, DEC); Serial.print(" - ");
  Serial.print("R: "); Serial.print(r, DEC); Serial.print(" ");
  Serial.print("G: "); Serial.print(g, DEC); Serial.print(" ");
  Serial.print("B: "); Serial.print(b, DEC); Serial.print(" ");
  Serial.print("C: "); Serial.print(c, DEC); Serial.print(" ");
  Serial.println(" ");

 // digitalWrite(greenLED, HIGH);
  int color = r + g + b;

  Serial.print("Color: "); Serial.print(color); Serial.print(" ");

  // If black is sensed turn green LED on, else red LED is on.
  if (color < 8000 && color > 7000){
    digitalWrite(greenLED, HIGH);
    digitalWrite(redLED, LOW);
  }

  else{
    digitalWrite(redLED, HIGH);
    digitalWrite(greenLED, LOW);
  }

}
As seen in the redSensor() function. It is within this function that the sensor reads the individual digitized color. A variable ‘color’ was created which summed these values, and then these values were compared to a predefined range which would measure the black strip on the white background. In this case, the range was from 7000 to 8000.
Test Results
Video: Color Sensor Demonstration
