Preliminary Design Review (PDR)
The purpose of the Preliminary Design Review (PDR) is to formalize all of the information regarding your project into something that anyone without prior knowledge would be able to understand what was being attempted. It will also help clear up any issues or misunderstandings between the customer and the team. This blog post provides information about what documentation is required and some examples of how to create them.
The PDR can be considered to be made up of two main sections, the project documentation and the project plan / schedule. The project documentation focuses on details about what the team will be designing and involves things such as the requirements, system block diagram, and software block diagram. The project plan / schedule outlines how the team plans to complete the project within the semester. You will be required to complete and present both for the PDR presentation.
Table of Contents
Outline
The objective of the Preliminary Design Documentation is to lay out the preliminary “technical” design of the project as defined by the Level 1 and 2 requirements, system design, and modeling. While the preliminary design needs to provide a clear description of the project, it is understood that the creation process follows the System Engineering Method and is therefore iterative by nature. You can consider this being a snapshot of the design process for future students to learn from if they continue working on the next generation of the robot.
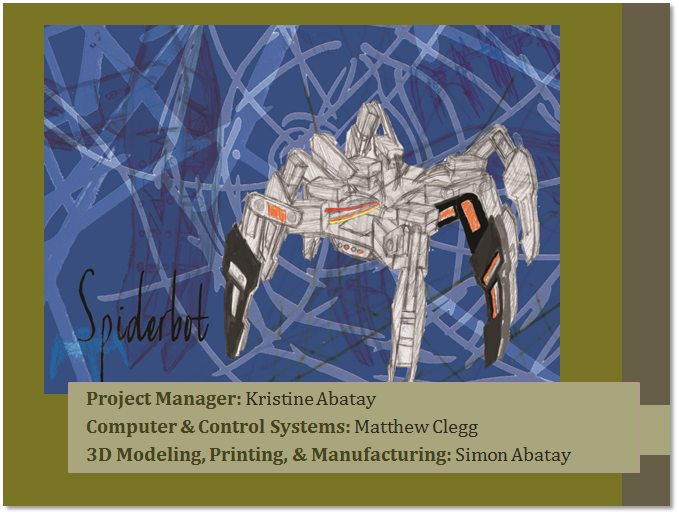
Title Slide / Cover Page
Program / Project
Objectives / Mission Profile
The process begins with the identification of the problem to be solved, and/or product to be built as defined by the customer and codified by the Program Objective Statement. Although the Program Objective may be in the form of a requirement, it is typically a qualitative statement of what the customer wants. These “objectives” are not developed in isolation or at a fixed point in time but like all elements of the engineering method, evolve over the life of the project.
For example, after a system design is selected and the manufacturing element of the project comes to the fore, you may need to ask the customer about how easily the widget needs to be put together or taken apart for repair. The answer may require a redrafting of the program objectives, program requirements, system/subsystem requirements, and associated verification tests.
The Mission Profile documents how the product will be operated by the customer and is focused on the conceptual operation (ConOps). For many of our robots, the Mission Profile is defined by the course it will run on the day of the Final. This can also lead to additional requirements being generated as you find issues that were not considered.
Constraints
Present Constraints on the project imposed by The Robot Company and Project Stakeholders as defined in the “Program Constraints” section of the “Realistic Constraints and Engineering Standards” lecture. Catagories include: Project/Economic, Social and Ethical, Manufacturability, Environmental Health and Safety (EH&S) Standards, and Functional. Adapt material under these categories as applicable to your project.
For example, any 3DoT project will have to follow these “Functional” constraints. You may have a requirement that is similar, so change it to use the wording shown here.
All 3DoT robots shall incorporate the 3DoT v8 or later series of boards.
Software shall be written in the Arduino De facto Standard scripting language and/or using the GCC C++ programming language, which is implements the ISO C++ standard (ISO/IEC 14882:1998) published in 1998, and the 2011 and 2014 revisions. Required exceptions to this standard can be found here.
All 3DoT robots shall be in compliance with the 3DoT Command and Telemetry Packet specification.
All 3DoT robots shall be controlled via Bluetooth 4.0 in compliance with the Bluetooth Special Interest Group (SIG) Standard (supersedes IEEE 802.15.1).
Requirements
Start by reviewing the following material.
From the mission objectives statement, Program and Project Requirements are written. Often the simple (only by appearance) process of defining a program requirement, will require rethinking program objectives and introduce new calculations that need to be performed, trade-off studies to be conducted, new models / prototypes that will need to be built, and experiments to be conducted. In other words each step in the engineering design process sends ripples both up and down the project.
- Each requirement should be numbered for later reference.
- While each requirement must be paired with one or more verification tests, this second step will be implemented in the next iteration of this document.
- Clearly indicate which level the requirement falls under. Make sure that the linkages for each level are apparent. Specifically, the level 1 requirements clearly show they were derived from the mission profile or project objectives. Level 2 requirements directly follow from Level 1 requirements.
You should indicate your initial thoughts on how to verify the requirement. This will help identify if you have worded the requirement properly.
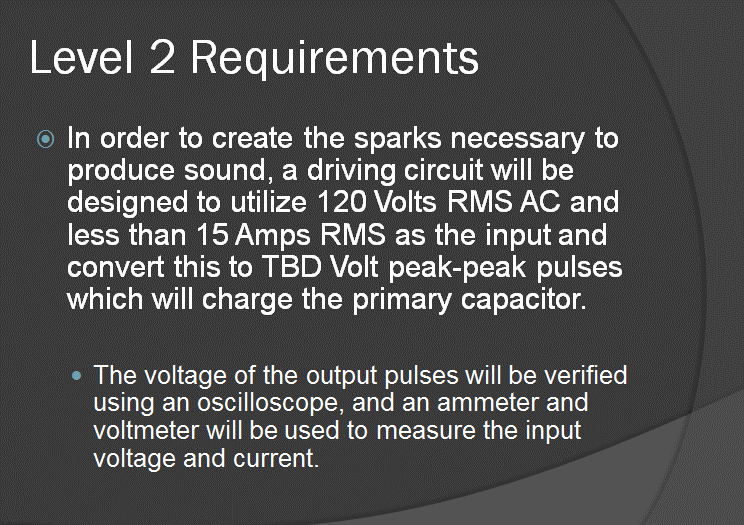
Here is an example from the Tesla Coil PDR.
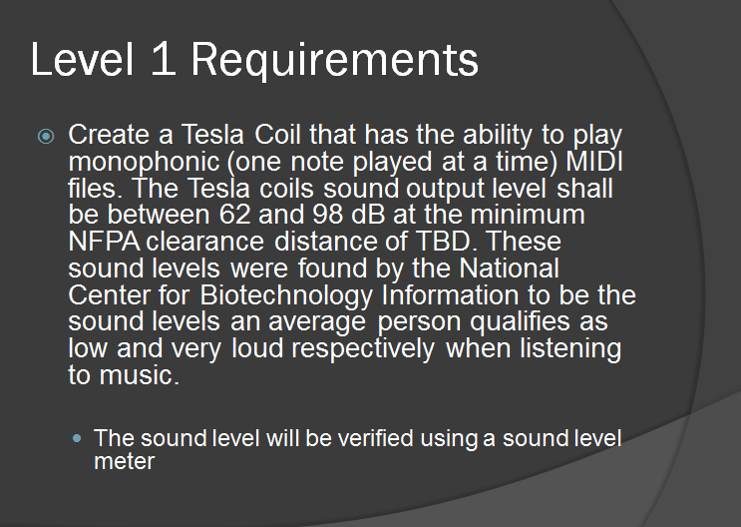
Once a system design is selected, the subsystems are defined. Definition of the subsystems is in the form of Subsystem Requirements and Design Specifications (Level 2 requirements).
Like the layers of requirements preceding them, each requirement level (program, project, system, subsystem), must be responsive to higher level requirement(s). They may never stand alone. To clarify, Level 2 requirements respond to Level 1 and Level 1 requirements respond to the project objectives / mission profile.
A single level 1 requirement will typically spawn multiple level 2 requirements; just as level 2 requirements can be traced to multiple level 1 requirements. In other words, there is not a 1:1 correspondence.
Design Innovation (As Applicable)
Once a first draft of the program/project requirements is done, the project team searches for creative design solutions (design ideas) for potential problems or issues that need to be addressed. This is where the creativity methods discussed in class can help.
This section is not required for problems or issues where the solution is dictated by the project objectives or mission profile. If the design solution has never been done by previous semesters, then this is needed in your presentation.
System Design
System Block Diagram
Another aspect of the system design is the clear definition of the subsystems and the interfaces that exist between them. From an electrical engineering perspective, this definition is predicated by the System Block Diagram, followed by a description of the subsystems, their interfaces and requirements.
This diagram should clearly define all of the subsystems that make up your project and show how they interact. One additional detail that would be helpful is to show how the subsystems fit together. For example, many subsystems will physically be within the chassis of your robot. It would be useful to represent that and show the interconnections on the inside.
Do not overload the diagram with long paragraphs describing each subsystems function. Be prepared to explain this verbally during the presentation.
The key thing here is to break down your project into its major parts and show how they are related. If it can be broken down further, make sure to present it in a way that makes sense.
Interface Control Document (As Applicable)
When two or more projects are subsystems of a larger project, they will need to coordinate how those subsystems interact. That results in the interface control document (ICD), which explains how the different interfaces of each project should be defined to keep everything organized.
Product Breakdown Structure
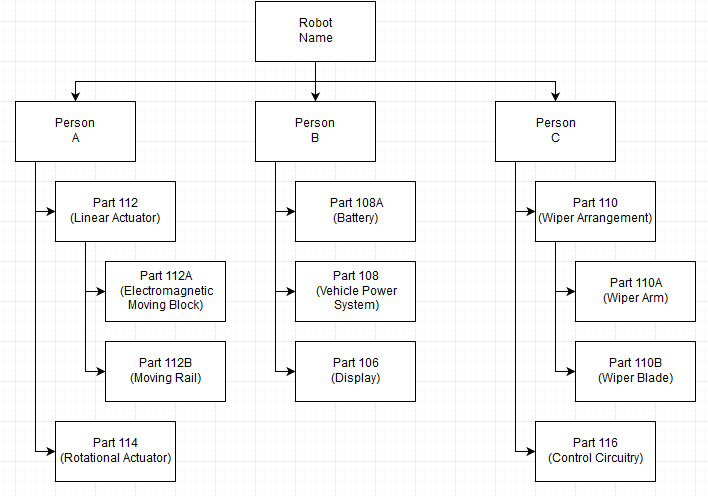
The major subsystems comprising the system are defined in the Product Breakdown Structure (PBS). The WBS will be covered in the Project Plan / Schedule section of this post.
The important thing about this section is that a specific person is clearly associated with a product deliverable. It is based on the system block diagram and WBS. Everything shown in the PBS should be representative of the details from those documents. An example is shown below.
Subsystem Design
Software Design
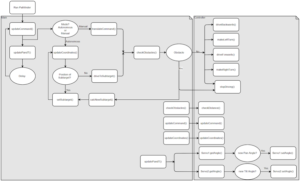
This section includes any material that helps portray how the software will need to work. It can consist of program flowcharts, block diagrams, or any other visual aid to show how the final code will perform.
Application Customization
If your project needs to incorporate the Arxterra Control Panel or ArxRobot app in any way, you will need to show how it will be used and/or customized.
Firmware Customization
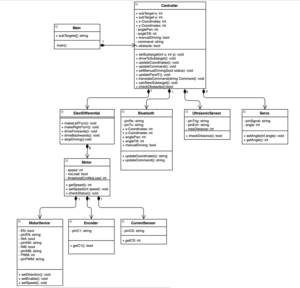
It also shows custom MCU Firmware that needs to be generated. As things are being planned out, you may use placeholder names for the functions needed as long as it is relevant (does not need an explanation for what the purpose is).
You should make use of the universal modeling language (UML) for these diagrams. This is shown below with examples taken from Pathfinder Generation #7’s PDR.
The first diagram is showing how the functions will interact with each other and at what point in the program they will be called from. It helps show how the structure will be implemented.
The second diagram is showing additional details about each function and the variables involved with each.
Electrical Design
For a microcontroller based design, the electronic interface definition begins with the Interface Matrix and is finally documented by detailed schematic(s). At this point, there should be a clear picture of what will be going onto the custom PCB shield that will be designed.
Interface Matrix (Optional)
As an option your project may provide an interface matrix for each microcontroller or printed circuit board (PCB) to indicate the different wires and their function on that board. Shown below is an example of how this should be done. While it may be tedious, you should indicate all available pins for the device and indicate when that resource has been taken.
| Pin | Name | Sensor Shield |
| 1 | SCL | NC |
| 2 | SDA | NC |
| 3 | 3.3V | 3.3V |
| 4 | GND | GND |
| 5 | AO | IR_R_O |
| 6 | A1 | IR_R_I |
| 7 | A2 | IR_L_I |
| 8 | A3 | IR_L_O |
Electrical Breadboard
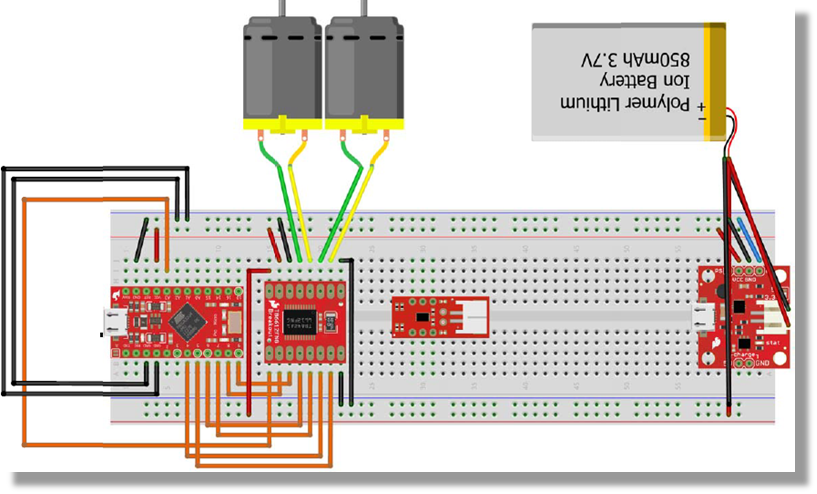
For the PDR it is sufficient to document the electronic design using a Fritzing diagram and/or photograph of the breadboarding done. This should lead to the custom PCB shield schematic created in EagleCAD, which may also be shown in the presentation (i.e., optional).
You can find additional information on how to make the Fritzing diagram here.
Mechanical Design
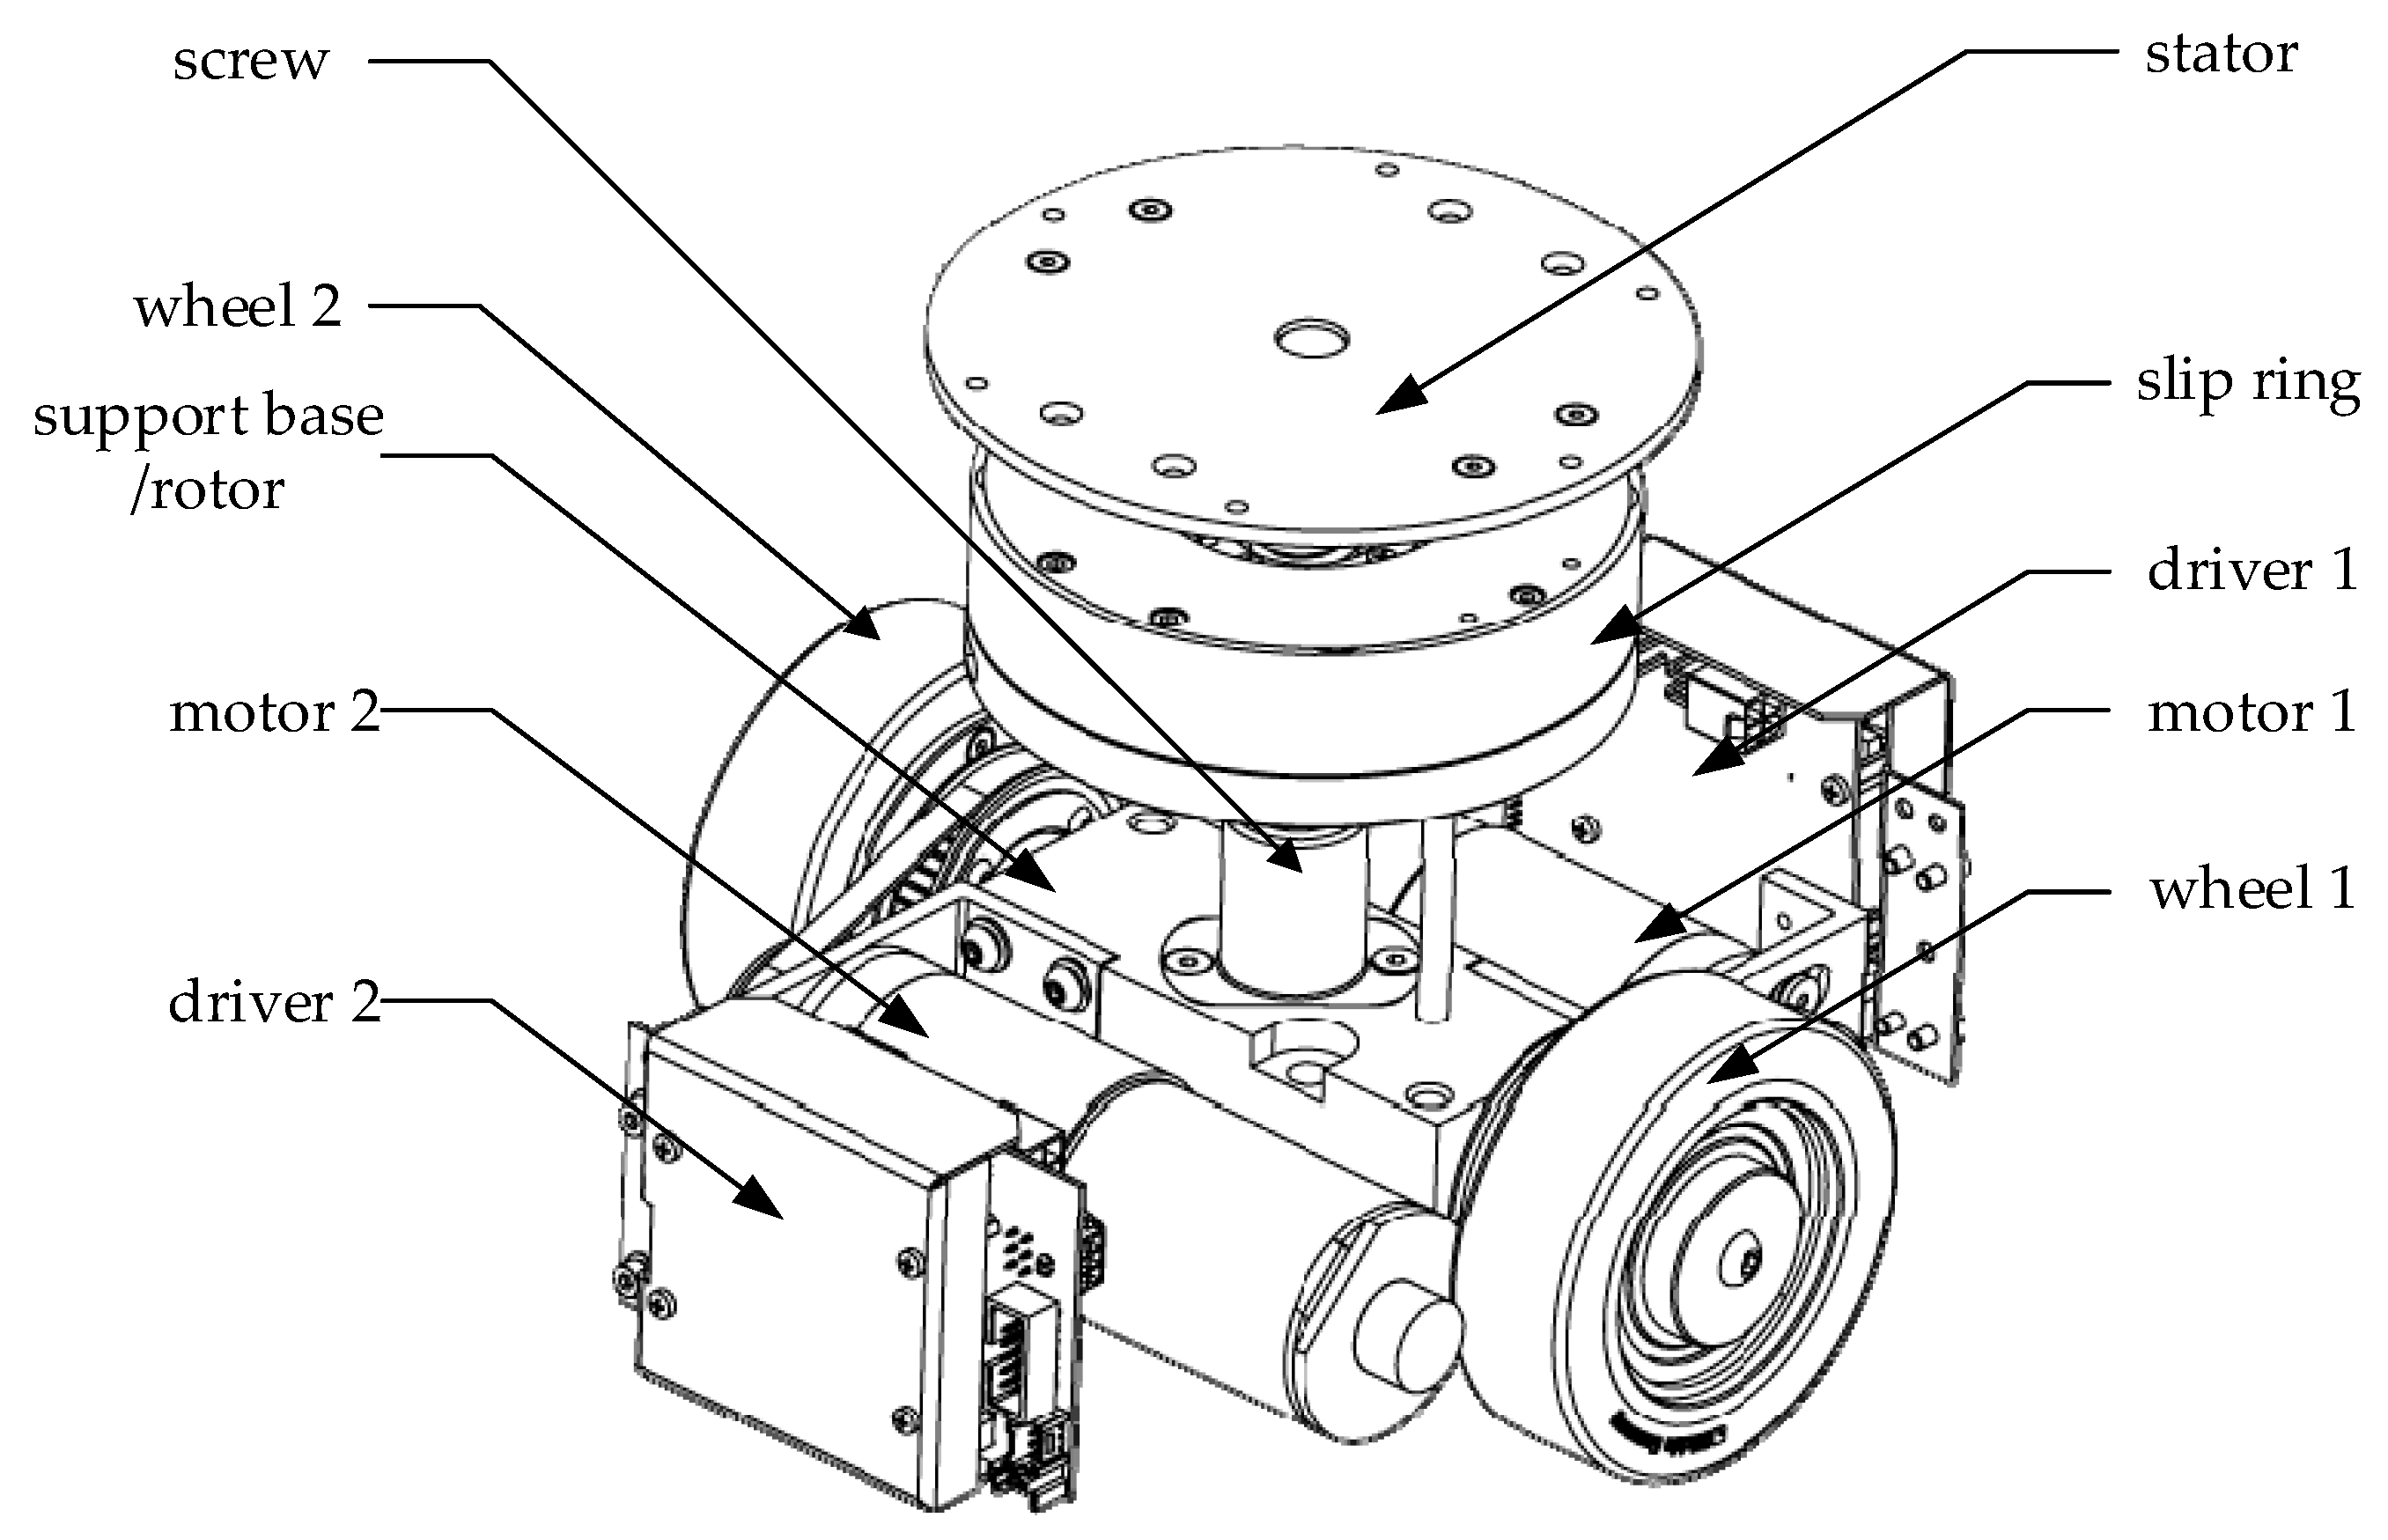
From a mechanical engineering perspective, the system design is predicated by a 3D mechanical rendering of the system with sub-assemblies clearly identified. This is typically done with an annotated exploded view of the system, followed by a description of the subsystems, their interfaces and requirements. Ideally, the best representation of the system will be from SolidWorks models but the complexity of the project may make it difficult. If you feel the model is lacking, include additional material only if they add to the presentation.
Do not show pictures of hand drawn sketches or Microsoft Paint drawings.
Source: A Master-Slave Separate Parallel Intelligent Mobile Robot Used for Autonomous Pallet Transportation
Project Planning
Work Breakdown Structure
The WBS is a hierarchical breakdown of the work necessary to complete the project. (NASA System Engineering Handbook Section 4.3.2.1 Product Breakdown Structure).
Your WBS should be taken to a level such that tasks within each structural element are assigned to a single engineer. Specifically, organize all your tasks into groups in some hierarchical tree structure where each node (group) is the responsibility of only one engineer. Normally, the hierarchy will fall along Division/Section/Group lines.
 Loading...
Given that we are not following the matrix organization this semester, the WBS should be structured according to the project members and the work that they are responsible for. IE Person A is responsible for Task 1 (designing 3D model), Task 2 (Printing and assembling robot), etc. You can find more information about the WBS from the class lecture.
Design and Unique Task Descriptions
After a first pass through the Engineering Process, you should have a fairly complete set of Task Definitions. These definitions include a short description of each task that needs to be performed and its duration. Once these tasks are defined, the projects take them to the divisions where engineers are assigned to complete them across the division (see Work Breakdown Structure). For example, if multiple projects need to know more about the characteristics of a servo, then only one engineer needs be assigned to gather information, define a test plan, and then conduct and document the test results.
Each member should develop the list of tasks that they will be focusing on in the coming weeks. A brief explanation of how they plan to approach it should be provided. For example, the E&C engineer is responsible for the custom PCB design and they may plan to breadboard the individual components that will go on the PCB to confirm how the wiring should be done before developing the schematic. It may take two weeks or more for breadboard testing, evaluations of the design, and revisions before being complete.
These tasks can include applicable sketches, back of the envelope, trade-off studies, models, etc.
Trade off studies must begin and end with requirements that are the key factors in making a choice. Trade-off studies must be quantitative.
Avoid words like: Typically small, Large Torque, Very accurate and precise, Highly efficient, Has reserve power and torque, more likely to malfunction if subjected to overload, precise positioning, stable, quick starting and stopping, small step distance, it’s possible to “skip” steps with high loads, draws maximum current constantly, low self-discharge, very high energy density, A little expensive, high shelf life. Provide exact values if possible from datasheets or calculations to allow for accurate comparisons.
The main focus of this section is to lay out what are the critical things each team member will be working on and how they may plan to do them.
Once that is covered, you should present the results from any experiments that you have performed. For example, any breadboarding or back of the envelope calculations that were performed should be discussed here.
Do not simply copy-paste material from previous generations of documents. Give proper credit for any work that you not responsible for.
Project Schedule
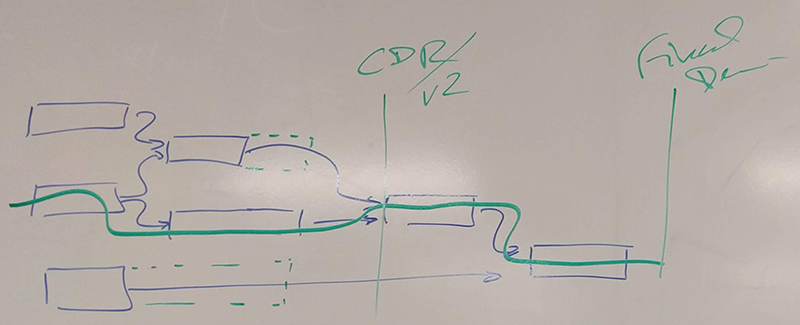
For the project schedule, create a timeline of the tasks that will need to be completed based on what was covered from the “Design and Unique Task Descriptions”. This can be done in Microsoft Excel or Google Spreadsheet and should indicate the description (from the previous section) and duration of each task. Make sure to also include the major milestones such as the V2 Demo, CDR (November 5th for both) and the final (December 12th). Limit to aproximatly twenty (20) tasks.
The following figure shows a simple seven (7) task “waterfall” schedule. Each task is represented by a blue box. Dependency between tasks is shown by a blue arrow. The two milestones described in the previous paragraph are also shown. The critical path is shown in green. While the completion times of blocks not on the critical path can slip (illustrated by dotted green lines), any slips in tasks on the critical path will result in the project not meeting one or more of the project milestones.
(OPTIONAL)
The top level schedule provided in this section should be developed using Microsoft Project or Project Libre. The top level schedule should be built from (linked to) WBS modules. Each module should in turn be linked to system/subsystem level tasks. These tasks may include trade-off studies and modeling (including rapid prototyping) as described in the next section and defined in the Preliminary Design Document. This is because it will help show how the tasks are dependent on each other and keep track of progress being made. Ideally, you will be able to get to this point a bit later in the semester.
From Microsoft Project, create a table of tasks needed to implement the project at the System and Subsystem level as defined by your WBS. A time estimate with uncertainty should be attached to each task. These tasks should be in response to those tasks defined in the Preliminary Design Document.
If you have any other project management software that can generate this, feel free to use that as an alternative to Microsoft Project or Project Libre.
Burndown (Optional)
The purpose of the burndown diagram is to show the projects progress up to this point. Depending on how the project schedule is defined, it should give an estimation of how work should be progressing.
The percent of project completion is computed as follows. When a task is started, 50% of its weight is assigned as completed. When a task is completed, the remaining 50% is added to the score. Task completion must be approved by the president or the vice president. Proof of completion (blog post, documentation, etc) needs to be provided for each task before it can be considered finished. There are two approaches to how to define the burndown diagram.
Each task can be evaluated based on percentage completion or the number of hours it would take to finish.
For the first method, the total number of tasks needs to be considered. As each task is completed, you compare it to that total. I.E. 5 tasks are completed with another 4 that have started. That would correspond to 7 tasks (1 for each task done and 0.5 for each started) out of a total of 30. Therefore the total percentage done would be 23.33%.
For the second method, the total number of hours needs to be considered. As each task is completed, you compare it to that total. I.E. each task may vary for the number of hours needed. Assume the average is 4 hours for each task. For 5 tasks completed and 4 that have started, it would correspond to a total of 28 hours (4 for each completed task and 2 for each started task). If the total for the project is 84 hours, the total percentage would be 33.33%.
System Resource Reports (As Applicable)
Resource Reports (i.e., resource allocations), as they are applicable to the project, show how shared resources are allocated among the different subsystems. For example, power allocation/estimate for each subsystem module help to evaluate the total needed for the battery. Each resource should have a margin attached to it based on the uncertainty in the estimate. It should also show contingency, where contingency is defined as the project allocation minus the estimate and total margin.
One important consideration for these resource reports is that the project allocation for that resource needs to be justified or derived from a requirement. Often, this is arbitrary due to the characeristics of a student project. However, to be realistic, there is some form of a constraint that limits what is allowed. Therefore, the project allocation for each resource needs to be clearly defined as it shows how the design may run into problems with the choice of components and leads to the specifications of what is needed (operating voltage, etc).
For example, most projects will need a power resource report. This report would factor in the available power, typically the current rating of the RCR123A battery selected, and the operating time, typically a function of the mission profile.
Mass
This section is dedicated to the total mass of the project. Also in a tabulated format, it should contain the expected weight, measured weight, percent uncertainty, and margin for each respective resource being used in the project. Lastly, it should contain total expected weight, total margins, project allocation, and contingency.
Power
This section shows the different power demands of the various components used. There are several ways to represent the power (watts, mA, or mAh), so make sure to pick one. Typically represented in a tabulated format, it should include an expected current drawn, measured current drawn, percent uncertainty, and margin for each resource consuming power (for the mA case). Lastly, it should contain total expected current, total margins, project allocation, and contingency clearly showing the power source selected will support the project.
Other Shared Resource Report(s) / Allocation
Any other resources tracked by the system engineer. For example, projects using the libraries 3D printer, should show how cost is minimized, based on library’s pricing algorithm.
A unique resource report for the Card Shuffler project would be related to their Mission Profile. For example, a time resource report is needed to indicate how much time each part of the process should take in order to shuffle and identify if any cards are missing.
Cost
Within the introduction of this section, please indicate the funding source for this project.
This is a table containing a parts list of all items to be purchased in support of the project. Each line item should include a margin if the actual item to purchase has not been defined. It is important that the estimate be as comprehensive as possible. Please do not leave off the list items for which you are know you will need but currently have not identified a model number/source. For example if you know you are going to need a servo but am not sure about which one then research the cost of servos and use the mean cost as an estimate with an uncertainty that makes sense. Finally, at the end of the table add a margin. This is to cover any contingencies including broken parts, parts you forgot about, etc. This margin should decrease with time as the project becomes better defined. If there are any parts that you will be borrowing from the cabinets or previous generations, please indicate those as well on this list and consider their actual cost to be 0. Add a note that it is being provided from previous semesters.
PDR Grading Rubric
The PDR presentation will be graded, consistent with the outline of this document. Sections and material designated as “optional” and “as applicable” are not required.
