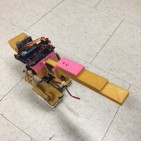
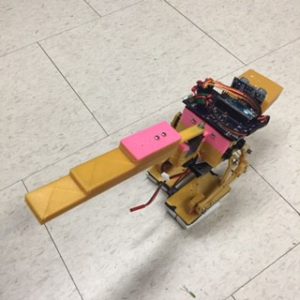
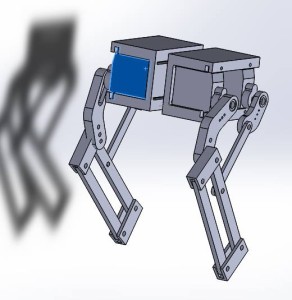
Fall 2015 MicroBiPed Summary

PROJECT SUMMARY

By Paul Oo (Project Manager)
Approved by Paul Oo (Project Manager)
Approved by Railly Mateo (Systems Engineer)

IMG_1949

Executive Summary

Project Objectives and Mission Profile:

Fall 2015 MicroBiPed (BiRex) is inspired by the BiPed designed by Jonathan Dowdall of Project BiPed. The profile for this semester’s project is to use the BiPed & μBiPed designs to create a toy robot. The chosen design for a BiPed toy is a Tyrannosaurus Rex. To push the profile towards a feasibility demonstration requires a large emphasis on performance and budget. The objective of this project is to complete an obstacle course whilst controlled and communicating with the Arxterra™ Android application.    

The detailed changes made to the Project Objective and Mission Profile can be found here.

Design:

explode

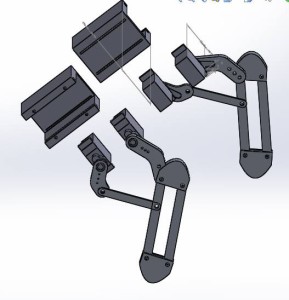
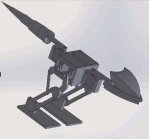
Figure 1 – Exploded Model

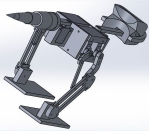
The image above shows the full 3D SOLIDWORKS structure. In this exploded view, the structure shows each individual component designed on SOLIDWORKS. Although there are additional components, (PCB, sensors, wires, and battery) this image shows the overall design of structure.

Details on the structure can be found further in this blog post under “Hardware Design.”

Project Features:

sUT1KxuhOODsvIs

Figure 2 – BiLeg

BE1erpvREUroUMP

Figure 3 – BiLegs

KacvikPYbjjddWS

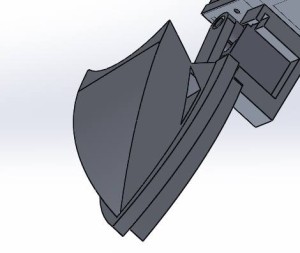
Figure 4 – BiHead

BuwU8tfdkHppg8I

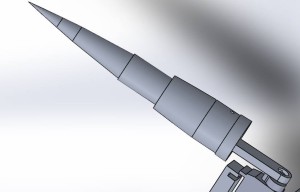
Figure 5 – BiTail

CEtJCOXbzxYY4ha

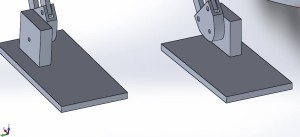
Figure 6 – BiFeet

The images above shows the creative solutions we implemented on this year’s µBiPed. During the production of the structure, our little BiRex was given the nickname of Bisexual T-Rex. Coincidentally, the name fit the design. Every one of these features have the capability to be flipped and still be functional.

Further analysis of Figure 6 (BiFeet) can be found in the Stress Analysis blog post.

System Design

block diagram(1)

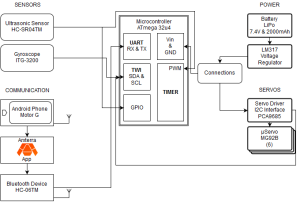
Fig. 7 – System Block Diagram

The block diagram above shows the updated block diagram for BiRex. This system diagram shows the high level information; mainly connectivity between subsystems through their peripherals. The blocks are positioned based on their subsystem information. As taught in EE 346, the microcontroller (Arduino Micro) acts as the computer to receive (inputs) and send out (outputs) information throughout the whole system.

Each subsystem’s properties can be understood by reading the Updated Interface Matrix and Finalized System Block Diagram blog posts.

Experimental Results

Conducted Experiments:

List of Experiments

Title of Experiment

Type(s) of Experiment

Walking Configuration and motion
Prototype Leg, legs, and full structure
3D Printing Servo holder
Battery Power Budget
Gyroscope Connection
Ultrasonic Connection
Servo Driver Connection
Servo Leg, legs, and full structure
Ankle Legs and full structure

The table above is a full list of experiments conducted after the PDR and up to the CDR. The titles that are bold are the next three topics (Battery, Prototypes, and Ankle) that give further information of each experiment.

Battery (Power Budget):

Item Quantity Max Consumption Average Consumption Total Average Consumption Total Max Consumption
MG92B (servos) 6 0.7488170658 0.02 0.12 4.492902395
Arduino Micro (microcontoller) 1 0.85 0.37 0.37 0.85
Ultrasonic Sensor
1 0.015 0.015 0.015 0.015
Gyroscope 1 0.0065 0.0065 0.0065 0.0065
HC-06 (Bluetooth) 1 0.04 0.008 0.008 0.04
Total 0.5195 0.9115
Regular Amps Available: 2 Surge Amps Available: 10
Margin%: 284.985563 Margin%: 85.0343344

The above table presents the electronics subsystem that comprises of this year’s µBiPed project. The subsystem consists of both the main (Arduino Micro) and sub-components (servos, ultrasonic sensor, gyroscope, and Bluetooth communication). These components were then spec’d for quantity, max, average, total average, and total max current consumption. From this data, we used the specs from our chosen battery to find marginal current ratings.

The full description of the the system’s current draw can be found on the Power Budget blog post.

Prototypes:

This is the third video from the Prototypes blog post. This specific video shows how we used the prototype to get a better understanding for making our Bipedal robot walk. This model is considered the 2nd Generation (2.5) of prototyping BiRex. As you can see, it has difficulty walking. This lack of balance comes from the fact that our legs cannot support overall stability alone, thus verifying the need to add the head and tail.

Ankle:

Results:

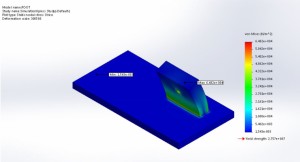
stress

Fig. 8 – Ankle: Stress Analysis

The von Mises test results. Solidworks allows you to determine which faces are stationary and which ones have forces acted on them. The ankle, which is the thick block, has all of the forces, and the red coloration indicates where the most vulnerable area is.

As a gauge, we considered the maximum force given by the robot as F = ma, which is the mass times the gravitational constant. In our case, 1.438 x 9.8 = 14.09N. The report indicated that the maximum force is above 65000N, which is way above our total forces.

Further details of the ankle design can be found on the Stress Analysis Blog Post.

Subsystem Design

Interface Definitions:

SzTI3jcuUVDzZkg

Table 1

Table 1 above show the 1st portion of project’s updated system interface definitions. The left side of the table has information on our subsystem components, while the right side is simply the microcontroller (Arduino Micro). Each component is then defined by its pinout data (pin number and pin symbol), which is then used as information for the microcontroller’s pinout.

7vtOa7MLNMDapYW

Table 2

Table 2 above show the 2nd portion of project’s updated system interface definitions. Unlike the first table, this section focuses only on our servo interface.

Further details of interface matrix can be found on the Interface Matrix Update Blog Post.

Custom PCB Design:

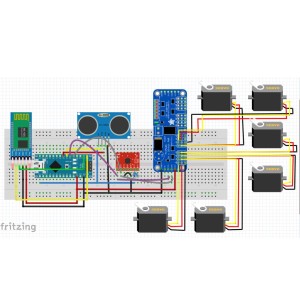
Fritzing Diagram:

System Diagram

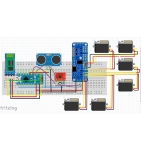
Fig. 9 – System Diagram

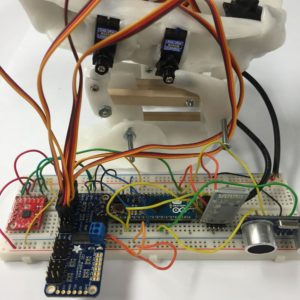
Breadboard:

Breadboard to Prototype (BinanoPed)

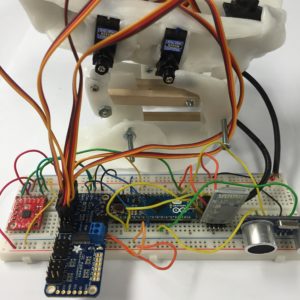
Fig. 10 – Breadboard to Prototype (BinanoPed)

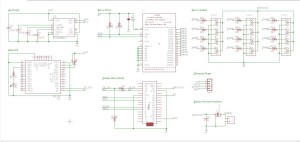
Schematic:

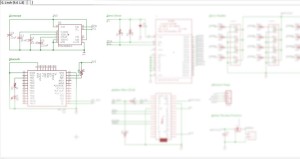
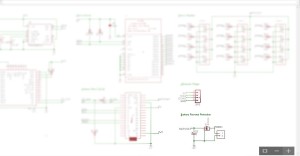
System Schematic

Fig. 11 – System Schematic

The system schematic blog post explains the steps needed to create an eagle file. The file used for BiRex is here: Eagle Schematic.

PCB:

Introduction:

The Final PCB layout is the responsibility of the Manufacturing engineer. To maximize the grade acquired for the assignment, a combination of through hole and SMD packages were utilized in the design.

Obstacles:

The problem presents itself when there are too many components on a board. Some components will have plenty of connections, sometimes to the point where there is no choice but to block other channels. Naturally, the solution to this would be to rotate the device. However, doing so can block even more channels. Another option is to create a double sided junctions. However, the double sided wires starts blocking other bottom sided channels utilized by other components. The only other option would be to go around it. Unfortunately, the free version of EAGLE has a limit of 2 in. x 2 ½ in; therefore, we do not have the liberty of space to maneuver around the conflicted part.
pcb

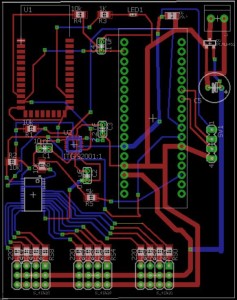
Final PCB Design. Note the part with the array of blue wires connected at the bottom left. That part is the servo driver, currently in the bottom of the board. Without it on the bottom, the order of the servo pins on the bottom would be convoluted.

The image above shows our finalized design for BiRex’s PCB. The red lines represent the copper tracing on top of the board, while the blue lines are underneath. An unpopular but effective method would be to have double sided SMD’s. By having an SMD on the bottom side, it is essentially mirrored by the axis that it is flipped on. This allows for some flexibility for routing.

Further details of interface matrix can be found on the PCB Blog Post. The full BRD file is provided here: MicroBiRex-Eagle.

Hardware Design:

3D Model:

The video above shows the simulation of the designed structure. The full STL file is provided here: Repaired. The full details can be found on the Center of Mass blog post.

Software Design:

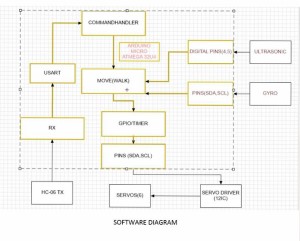
Software System Block Diagram:

software diagram

Walking Code (Introduction to IDE):

The walking code for the μBiped project was coded in the Arduino IDE using the basic syntax used in C, C++, and the like. The use of a servo-driver dictated the need of having the Adafruit servo-driver library (available here: https://github.com/adafruit/Adafruit-PWM-Servo-Driver-Library) added to the already existing Arduino libraries for use. The addition of this library allowed the use of more servos than would have normally been available using the Arduino alone.

PWM:

In order to control individual servos the Arduino would use PWM signals to the servo-driver with each PWM associated with a different angle. These different PWM values were then set in an array in order to allow smooth movement of the legs, head, and tail that the servos were made to control. In order to get smoother movement, longer arrays were required to show more individualized movements.

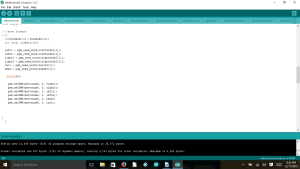
code1

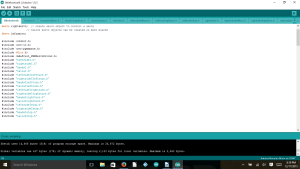
Fig. 1 – Include Files

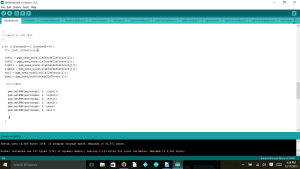
code2

The full details of the software design can be found on the Walking Code blog post. The full IDE file is here: IDE files.

Verification and Validation:

Test plans through verification and validation is needed to show the success of the project results. This document is then used by the course instructor. The document is essentially used as a checklist with results of the project tied to project and program requirements.

The full details of the test plans can be found on the Test Plans for Verification and Validation blog post.

Project Update:

Work Breakdown Structure:

The Work Breakdown Structure (WBS) is used by those that deal with higher level program information The list of those involved include, but are not limited to: Project Manager, Systems Engineer, President, and Division Managers.

Table 1 – Project Manager

Operation Duration Start Finish Resource Name
Project μBiPed 162 days 8/31/15 12/10/15 Paul Oo
Project Management 155 days 9/10/15 12/10/15 Paul Oo
Mission Objective 21 days 9/10/15 10/1/15 Paul Oo
Program Req. 21 days 9/10/15 10/1/15 Paul Oo
Work Allocation 21 days 9/10/15 10/1/15 Paul Oo
PDD 8 days 9/23/15 10/1/15 Paul Oo
PDR 7 days 10/1/15 10/8/15 Paul Oo
CDD 21 days 10/8/15 10/29/15 Paul Oo
CDR 7 days 10/29/15 11/5/15 Paul Oo
Documentation 168 days 8/24/15 12/9/15 Paul Oo
Final Presentation 35 days 11/5/15 12/10/15 Paul Oo
Project Video 70 days 10/1/15 12/10/15 Paul Oo

The table above (Table 1) shows the schedule created for the Project Manager. This schedule has been made to fit Fall 2015’s 400 D timeline and milestones. Furthermore, the schedule has been broken down according to program tasks (Mission Objective, Work Allocation, & Documentation). To improve this schedule, along with other members’, project managers should view this document from the first day of being assigned to their position.

The schedule for Systems, Manufacturing, and Controls Engineers can be found on the WBS blog post.

Mass Budget:

Mass is important for every project. The mass can affect both the hardware and software design. While, the components used for movement are affected by the structure (load), the software must account for the physical resistances the structure produces.

Part Quantity Individual Mass (grams) Total
(grams)
Margins
Servos 6 13.8 82.8 20%
#4 Hex Nuts and Bolts 18 20.7 372.6 10%
Frame 1 857.29 857.29 100%
Ultrasonic Sensor 1 8.5 8.5 10%
PCB (HC-06 & Arduino) 1 30.76 30.76 100%
Dynamite LiPo 1 86 86 10%
Grand Total (Grams) 1437.95 68%

The table above shows the data for mass of this year’s µBiPed project. The mass values obtained from data sheets are given a 10% margin of error. The frame’s mass is assumed to be an Aluminum build. Therefor, the mass may change drastically if a different material (polylactic acid) is more viable.

The full details of the mass budget can be found on the mass budget blog post.

Power Budget:

Power and Mass budgets are a bit more difficult to conclude early on. The reason comes from the changes that made to the structural and PCB designs as the semester progresses.

Item Quantity Max Consumption Average Consumption Total Average Consumption Total Max Consumption
MG92B (servos) 6 0.7488170658 0.02 0.12 4.492902395
Arduino Micro (microcontoller) 1 0.85 0.37 0.37 0.85
Ultrasonic Sensor
1 0.015 0.015 0.015 0.015
Gyroscope 1 0.0065 0.0065 0.0065 0.0065
HC-06 (Bluetooth) 1 0.04 0.008 0.008 0.04
Total 0.5195 0.9115
Regular Amps Available: 2 Surge Amps Available: 10
Margin%: 284.985563 Margin%: 85.0343344

The above table presents the electronics subsystem that comprises of this year’s µBiPed project. The subsystem consists of both the main (Arduino Micro) and sub-components (*servos, ultrasonic sensor, gyroscope, and Bluetooth communication). These components were then spec’d for quantity, max, average, total average, and total max current consumption. From this data, we used the specs from our chosen battery to find marginal current ratings.

The full details to the battery used and power budget can be found on the battery update and power budget blog posts.

Progress:

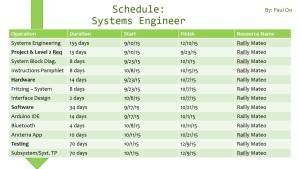
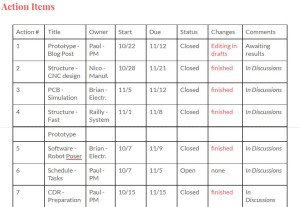
There are a multitude of ways to record the progress of your project. We used project libre as our initial source for layout the schedule. Unfortunately, the software’s user interface just wasn’t well designed. Regardless, the progress had to be documented. The most useful tool for progress actually came from using action items from the group meeting notes. This table allowed us to keep in touch of how close we are to small and large milestones.

systems pro

Systems Engineer Schedule

systems wbs

Systems Engineer – Work Breakdown Structure

action items

Meeting Notes – Action Items

Project Video:

The project video is a summary of BiRex and how we used the engineering method to produce our final result.

Conclusion for 400 D:

In conclusion, although it may seem infeasible, sticking to the program schedule will be the deciding factor to how successful your project will turn out. The project manager and system engineer should work hand in hand throughout the entire schedule to plan and prepare for any contingencies. The work they distribute is then placed on the subsystem engineers: manufacturing, electronics, controls, etc. Below is the recommendations I have personally made for future 400 D students.

Scheduling – Realistic 15 weeks

Weeks 1 – 4 : Students have two responsibilities:

  1. Become familiarized with their project (Project Documentation)
    1. The professor should debrief the intensity of the course and progress made per project (suggesting the difficulty in learning curve per project)
    2. The students should be assigned for their positions coming into the course (given that they are provided with brief and/or full outline of WBS)
  1. Become familiarized with their roles (Role Documentation)
    1. The students should be assigned role research as homework assignment:
      1. The students are then expected to present what they researched as an oral presentation (graded on content of information)
      2. Work with division managers to implement certain software assignments (then create blog posts off of what they learned)
  1. The purpose of these assignments are then to create a PDR

Notes: High learning curve for Project Manager and Systems Engineer  

Weeks 5 – 8 : Students have one responsibility: Apply new-found knowledge to implement PDR towards CDR

  1. The Project Manager and System should collaborate for scheduling
    1. The schedules can be referenced from getting access to Drive or PDR
  2. The subsystems should begin tailoring the researched 3D model, PCB, and IDE files to meet their PDR (rapid prototypes)

Weeks 9 – 15 :    More prototyping and testing

Documentation – Implementation (Project vs. Role)

Project: Arxterra – Archive

  1. Archive blog posts for individual community
    1. To make it clear, add the requirement of titling each blog post with Semester, Year, Community, and event of post.

Role: Drive – Meeting Notes, Folders, giving access

  1. Meeting Notes should be the same format (use either BiRex’s) or template from Drive.
  2. Folders should be implemented in Drive to allow clarity and ease of access.
  3. Should the students need it, request for access to previous semester’s drive folders.

Role: Software – How-to, video blog post

  1. The students should properly document their work and what they’ve learned.
    1. How-To – Fractal Antenna is an example of a blog post that gives quantitative information.
    2. Video blog post (record their work and orally annotate)

Fall 2015 MicroBiPed System Schematic

EAGLE SCHEMATIC

By Brian Walton (Controls Engineer)
Approved by Paul Oo (Project Manager)
Approved by Railly Mateo (Systems Engineer)

Introduction to Eagle:

Using EAGLE as a tool to build your schematic for all your subsystems offers multiple advantages:

1) Easy to use set-up aides with ease of schematic building
2) A large number of electronic companies support EAGLE and as such they provide libraries to add to your already existing EAGLE libraries to allow the use of their parts in the EAGLE software.
3) EAGLE comes with a built in PCB (Printed Circuit Board) software to easily go from the schematic to designing the PCB.
a) The available libraries allow using different size components as well as through-hole and surface-mounted components to add to the customization of the PCB to fit size and functionality requirements of the project at hand.
4) Building a schematic through EAGLE shows exactly what components are required for assembling the PCB allowing easy creation of a BoM (Bill of Materials) to simplify in the ordering of materials.

Our Eagle Schematic:

The full schematic can be downloaded from here: Eagle Schematic.

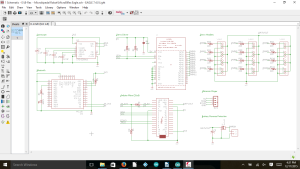
eagle1

Fig. 1 – Complete Layout

Project μBiped, also known as Project BiRex and Project Little Foot, required the use of a servo driver, Arduino Micro, Ultrasonic, Gyroscope, Bluetooth, and Battery Reverse Protection.

eagle2

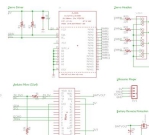
Fig. 2 – Gyroscope

Figure 2 focuses on the gyroscope from the overall schematic. It was decided to place the IC (integrated circuit) for the gyroscope directly to the PCB instead of using through-hole pins for the component itself. As a result extra capacitors had to be added to maintain the functionality of the gyroscoope.

eagle3

Fig. 3 – Bluetooth

Figure 3 focuses on the Bluetooth from the overall schematic. The HC-06 was placed directly onto the PCB to allow wireless communication with the Arxterra application on a phone. The layout chosen for the schematic dictated the use of a HC-06 without a backboard.

eagle4

Fig. 4 – Servo Driver IC

eagle5

Fig. 5 – Servo Driver components

Figure 4 focuses on the servo driver from the overall schematic. The servo driver IC was also laid directly onto the PCB, requiring extra resistors and a capacitor to maintain functionality. In conjunction with the servo driver, figure 5 shows the components needed to use the driver. It was required to have headers to be able to attach the servos to the PCB. Resistors were added onto the signal lines. The servo driver allowed the use of up to 16 servos which was quite a bit more than the 6 required for the project. The size requirement for the PCB allowed extra servo headers to be added to the design so the PCB allows for the use for up to 12 servos.

eagle6

FIg. 6 – Arduino Micro and Ultrasonic Sensor

Figure 6 focuses on the Arduino Arduino and Ultrasonic Sensor from the overall schematic. The Arduino Micro and Ultrasonic were placed directly onto the PCB.

eagle7

FIg. 7 – Battery

FIgure 7 focuses on the battery from the overall schematic. Battery Reverse Protection was added for added safety of components. The value of the capacitor used (1000 μF) was chosen based off of the number of servos used.


Notes:

Once the schematic is designed it is useful to label all connections and organize the schematic to aide in PCB design.
A copy of EAGLE can be downloaded here:
http://www.cadsoftusa.com/download-eagle/


Fall 2015 MicroBiped Walking Code

BIREX WALKING CODE

By Brian Walton (Controls Engineer)
Approved by Paul Oo (Project Manager)
Approved by Railly Mateo (Systems Engineer)

Introduction to IDE:

The walking code for the μBiped project was coded in the Arduino IDE using the basic syntax used in C, C++, and the like. The use of a servo-driver dictated the need of having the Adafruit servo-driver library (available here: https://github.com/adafruit/Adafruit-PWM-Servo-Driver-Library) added to the already existing Arduino libraries for use. The addition of this library allowed the use of more servos than would have normally been available using the Arduino alone.

PWM:

In order to control individual servos the Arduino would use PWM signals to the servo-driver with each PWM associated with a different angle. These different PWM values were then set in an array in order to allow smooth movement of the legs, head, and tail that the servos were made to control. In order to get smoother movement, longer arrays were required to show more individualized movements.

code1

Fig. 1 – Include Files

code2

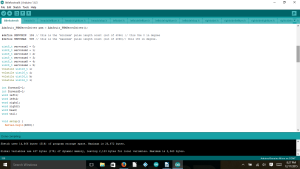
Fig. 2 – .h Files

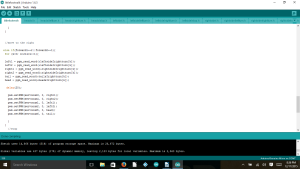
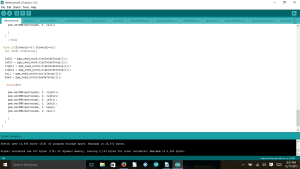
Once the arrays started getting passed 100 individual elements the Arduino Processor no longer had enough memory to handle this. Therefor look-up tables had to be incorporated. Using look-up tables allowed the change from the Arduino being unable to handle the individual arrays (which at the time there were only 4 arrays), to being able to handle 12 individual arrays (only taking up 17% of the dynamic memory and 51% of program storage space). In order to use program memory, figures 1 & 2 show how all of the arrays had to be saved as “.h” files and saved in the same file as the Arduino program.

Array Variables:

code3

Fig. 3 – Variable Names

code4

Fig. 4 – Variable Names (2)

code5

Fig. 5 – Variable Names (3)

code6

Fig. 6 – Variable Names (4)

Figures 3, 4, & 5 shows the variables used in order to add ease to coding later. The variables i,j,k, and l were added in order to scroll through the individual arrays. The variables forward1 and forward2 were defined in order to communicate with the Arxtera application as the combination of these 2 variables would allow 4 different individualized movements desired by the project: forward, left, right, and standing still. The variables left1, left2, right1, right2, head, and tail are used to take the arrays and translate it to the 6 individual servos and allows the program to be more iterative.

Long Array:

code7

Fig. 7 – Array Example

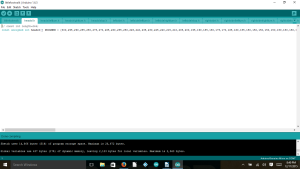
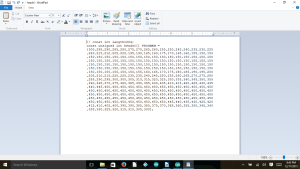
In the Arduino IDE the included files show up as long arrays in different tabs along the top of the IDE. The creation of these “.h” files were made in WordPad and is shown in Figure 7 & 8.

code8

Fig. 8 – WordPad

In order to learn how to use program memory to save space Professor Hill gave an example that will walk you through the process: http://web.csulb.edu/~hill/ee400d/Technical%20Training%20Series/(use the link that shows “Arduino_LookupTable.Zip”).


Fall 2015 MicroBiPed Verification and Validation Tests

VERIFICATIONS & VALIDATIONS REQUIREMENTS

By Railly Mateo (Systems Engineer)
Approved by Paul Oo (Project Manager)
Approved by Railly Mateo (Systems Engineer)

Here is the link to the full Test Plans for Verification and Validation.

Fall 2015 MicroBiPed PCB

PCB DESIGN

By Michael Balagtas (Manufacturing Engineer)
Approved by Paul Oo (Project Manager)
Approved by Railly Mateo (Systems Engineer)

Introduction:

The Final PCB layout is the responsibility of the Manufacturing engineer. To maximize the grade acquired for the assignment, a combination of through hole and SMD packages were utilized in the design.

Obstacles:

The problem presents itself when there are too many components on a board. Some components will have plenty of connections, sometimes to the point where there is no choice but to block other channels. Naturally, the solution to this would be to rotate the device. However, doing so can block even more channels. Another option is to create a double sided junctions. However, the double sided wires starts blocking other bottom sided channels utilized by other components. The only other option would be to go around it. Unfortunately, the free version of EAGLE has a limit of 2 in. x 2 ½ in; therefore, we do not have the liberty of space to maneuver around the conflicted part.

pcb

Final PCB Design. Note the part with the array of blue wires connected at the bottom left. That part is the servo driver, currently in the bottom of the board. Without it on the bottom, the order of the servo pins on the bottom would be convoluted.

The image above shows our finalized design for BiRex’s PCB. The red lines represent the copper tracing on top of the board, while the blue lines are underneath. An unpopular but effective method would be to have double sided SMD’s. By having an SMD on the bottom side, it is essentially mirrored by the axis that it is flipped on. This allows for some flexibility for routing.

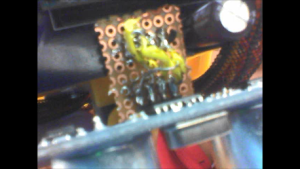
There were some unforseen problems, however. When the board was mounted on the robot, all of the parts were nominal except for the ultrasonic pins, which are the 4 pins on the right of the picture. The pins were oriented in such a way that the ultrasonic was facing backwards; we needed to mirror the pins somehow. We used a daughter board to jury rig the pins into flipping to correct the mistake, which is the brownish board in the following picture.

daughterboard

Conclusion:

In summary, if the design needs a mirror, a double sided PCB can be utilized. However, it is important to note that it can limit the mounting capabilities. Furthermore, when using Eagle, having a reliable mouse aids in alleviating the amount of controls needed to design.


Fall 2015 MicroBiPed Center of Mass

WORST CASE SCENARIOS FOR CENTER OF MASS TESTING

By Michael Balagtas (Manufacturing Engineer)
Approved by Paul Oo (Project Manager)
Approved by Railly Mateo (Systems Engineer)

Introdcution:

Solidworks calculates the center of mass and the overall mass of the model based on the present stance of an assembly. While walking, it is important to have the center of mass as close to the most supported leg to maintain balance. Unfortunately, only Solidworks premium has the motion analysis option, which calculates the parameters while the model is in motion.

Method:

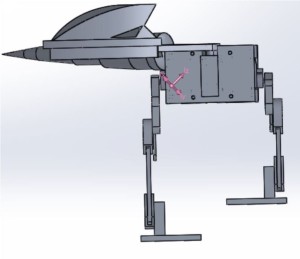
There is still an alternative to the center of mass study without the premium version, and that is with a worst case scenario test. That is, position the assembly in a manner where it is only supported by one foot, and the other is completely in the air. Naturally, there are two worst cases for a biped – one for the right leg and left leg worst case.

worst Right

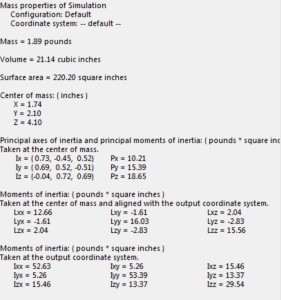
worst right calc Worst Case Scenario: Right Foot. The information on the bottom comes from the mass properties option in the Solidworks tools tab. Note the purple axis on the robot. That shows the center of mass on the robot, which is close to the joint, which is a good thing while walking.

The image above shows the worst case scenario test along with mass properties on BiRex. The goal is to have the pink axis as close to the leg as possible. When the pink axis arrows are at the leg (with the foot that is planted on the ground), then the BiRex is balanced. Other methods outside of the frame could be used for compensation.

Conclusion:

For the 2015 Biped team, this method helped validate the Level 2 requirement of maintaining balance while the robot is walking. This does not account for other unforeseen problems, but this test helped with validating one of our core requirements.

Fall 2015 MicroBiPed Stress Analysis

STRESS ANALYSIS USING SOLIDWORKS

By Michael Balagtas (Manufacturing Engineer)
Approved by Paul Oo (Project Manager)
Approved by Railly Mateo (Systems Engineer)

Introduction:

(This blog is written to accommodate stress test studies on strain heavy designs).

Previous Biped Robots had multiple joints connected by the servos. As such, it was easy to assume that, so long as the servo enclosure was thick and strong enough, the Biped could withstand the forces acted upon it during operation. However, for the 2015 BiRex design, the legs and joints are all connected via screws and nuts for articulation. Also, in order to reduce weight and size, some parts were thinned and holed, reducing their durability. This presents the team with a problem with the strain put on the joints and the parts as the BiRex moved.

Solidworks:

The parts had to be designed just enough to be easily manufactured and durable for walking. To accomplish this, the SimulationXpress feature on Solidworks was used to analyze the part for breaking points. The Simulation allows a user to determine which faces of the part will have a force applied into it (in the team’s case, the ankles) and which parts are stationary. It then allows the user to pick the specific type of material that the part is made out of, to determine the constants. By pressing run, the simulation starts calculating.

Results:

stress

The von Mises test results. Solidworks allows you to determine which faces are stationary and which ones have forces acted on them. The ankle, which is the thick block, has all of the forces, and the red coloration indicates where the most vulnerable area is.

As a gauge, we considered the maximum force given by the robot as F = ma, which is the mass times the gravitational constant. In our case, 1.438 x 9.8 = 14.09N. The report indicated that the maximum force is above 65000N, which is way above our total forces.

The simulation then compiles a report in Microsoft Word that shows the simulation parameters and results. The most important is the von Mises Stress, which determines the force at which a material deforms. By being below this, the part is guaranteed to retain state after operation.

Fall 2015 MicroBiPed Wiring Diagram

FINALIZED WIRING DIAGRAM

By Paul Oo (Project Manager)
Approved by Paul Oo (Project Manager)
Approved by Railly Mateo (Systems Engineer)

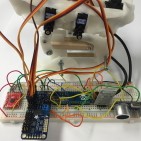
IMG_1746

Breadboard Wiring Diagram

The image above shows the system integrated (without the battery) and connected to the 3rd generation of the BiRex prototype. To reduce the wiring of the main electronics system, we designed our own PCB on EagleCAD.

(Picture of PCB)

The image above shows the custom PCB for our BiRex. The details for how we designed in can be found on our PCB blog post. As previously mentioned, the production of a PCB reduces the complexity of wiring and creates a aesthetically pleasing look.

ssPgNDIWtiMxW7O

Wiring Method

Considering this year’s Project Objective is a feasibility demonstration, the overall aesthetic design is not a high priority.  In the image above, the yellow board represents the PCB, the wires represent the servo connectors, and the black cylinders represent wire looms. What is not seen is the battery (will be placed underneath the body), and the ultrasonic sensor (placed in front of the battery).

Conclusion:
As this project continues to progress into different Mission Profiles and Project Objectives, future generations can rely on the design innovations to understand how these changes affect the overall objectives. For example, the year’s model could potentially conceal the PCB by covering the back of BiRex with a 3D backbone print. The analog sensors (gyroscope and ultrasonic sensor) are limited to only be placed on the body (the neck, tail, and legs are mobile).


Fall 2015 MicroBiped Motion Sensor

MOTION SENSOR TRADE-OFF STUDIES

By Railly Mateo (Manufacturing Engineer)
Approved by Paul Oo (Project Manager)
Approved by Railly Mateo (Systems Engineer)

Parameters Gyroscope (ITG 3200) Accelerometer (ADXL335)
Input Voltage 3.3 3.3
Acceleration 10,000G 10,000G
Operating Temp Range -40 TO +105 CELSIUS -55 TO +125 CELSIUS
Storage Temp Range -40 TO +125 CELSIUS -65 TO +150
Price 16 to 20 dollars 14 to 28 dollars
Dimensions 3.0×3.0×0.9mm 4 mm × 4 mm × 1.45 mm

Overview:

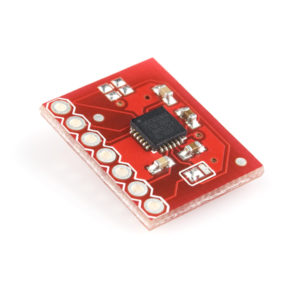
itg3200

ITG-3200

The accelerometer above is a compact device designed to measure non-gravitational acceleration. When the object it’s integrated into goes from a standstill to any velocity, the accelerometer is designed to respond to the vibrations associated with such movement.

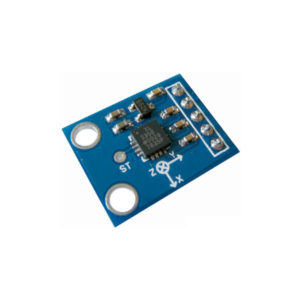
229-a-adxl335-triple-axis-accelerameter-analog-output-600x600

ADXL335

A gyroscope above is a device that uses Earth’s gravity to help determine orientation. Its design consists of a freely-rotating disk called a rotor, mounted onto a spinning axis in the center of a larger and more stable. As the axis turns, the rotor remains stationary to indicate the central gravitational pull, and thus which way is down.

Trade-Offs:

The table above gives specification comparisons between a gyroscope (ITG-3200) and an accelerometer (ADXL335).

Conclusion:

For our robot we were planning on using a gyroscope to measure the level of an incline on which our robot maybe standing on. However, the gyroscope only measures the change in the surface and then it stabilize itself. For example, if the gyroscope goes from flat surface to an incline, it will detect the differences in ground and then it will set this ground as its new flat ground. In the other hand, if an accelerometer goes from flat to incline, it will display the change in surface and maintain the angle of inclination. Therefore, an accelerometer should be used instead of a gyroscope.

Fall 2015 MicroBiPed Arxterra Application

ARXTERRA APPLICAIONT & ARDUINO IDE

By Railly Mateo (Systems Engineer)
Approved by Paul Oo (Project Manager)
Approved by Railly Mateo (Systems Engineer)

Configuration:

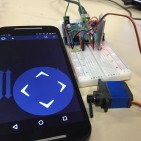
To establish communication between the robot and the phone, its important to know how the Arxterra application works and what kind of information it will send to the microcontroller (Arduino Micro). To interpret what the various telemetry commands were: the Bluetooth device (HC-06) was connected to the Arduino Micro. Next, the arxrobot-firmware was uploaded into the Arduino Micro to establish communication between itself and the Arxterra application (Android version).

Testing Connectivity:

To test connectivity, begin by opening he serial monitor on the Arduino. Play around by pressing on the Arxterra application. When the phone is not connected to the Bluetooth, the monitor will display “emergency exception 0x0100”. When the phone is connected, it will display “robber received command: 11”. When pressing on a direction (forward), five data inputs will be displayed on the monitor. According Hill’s command PDF file, the Arxterra application sends a 7 element matrix to the microcontroller.

Data Interpretation:

Data [0] A5 = Command Packet ID
Data [1] 05 = Packet Length N w/o parity byte
Data [2] 01 = Move ID
Data [3] 01 = Left Motor Forward
Data [4] 80 = Half Speed (128/255)
Data [5] 01 = Right Motor Forward
Data [6] 80 = Half Speed (128/255)
Data [7] A1 = Longitudinal Redundancy Check (LRC)

For our robot, the only elements of interest are data [2], data [3], and data [5]. This is due to our project only using servos, in comparison to using servos and motors. Thus the speed of the robot will only be controlled by using delays in the walking code.

Data [2]: if the command bit is 1, that tells the command decoder to issue a move command.
Data [3] and [5]: These elements are direction bits. If both are set to 1, it is interpreted as forward direction (would mean the reverse direction). However, our servos don’t go in reverse, therefore we won’t be setting these elements to 2.

Setting Up Walking Code:

Begin by pressing on the arrow control panel. Then write down all the telemetry responses that would be needed. By playing with remote functions, you will notice that setting data[3] and [5] to 1 and 1 will be move forward, 1 and 2 will be move to the right, and 2 and 1 will be move to the left.

Walking Command Examples:

If (data3 == 1 && data 5 == 1), the Arduino will read a series of servos angle that will make the walking forward motion.
If ((data3 == 1 && data5 = 2)), the Arduino will read a series of servos angle that will make the right turn.
If ((data3 = 2 && data5 == 1)), the Arduino will read a series of servos angle that will make the left turn.

You can see the implementation of the code in the Prototype blog post.