[av_textblock size=” font_color=” color=”] Requirement: Goliath shall have a custom PCB
For CDR, our goal was to create a PCB Layout using EAGLECAD from the schematic that the ENC created. Our PCB consist of speakers and RBG LEDs. The PCB is double sided. The following will explain the process of creating our custom PCB.
[/av_textblock]
[av_textblock size=” font_color=” color=”] When creating our PCB layout, we must first determine the placement and location of the PCB on our model. Since we would like to display our RGB LEDs, the most ideal location would be in the front of the top panel of our Goliath. Next, we figure out the dimensions of the location and create our outline of the PCB. In our case, the PCB outline dimensions were 53.34mm x 16.41mm.
[/av_textblock]
[av_textblock size=” font_color=” color=”] Second, we place the components accordingly and determine which components will be placed on the top and bottom layer. The top layer will consists of one 100 ohm 805 resistor, one NPN transistor, five SMD RGB 5050 LEDs that will display the distance and the direction of the Biped and a trimpot to adjust the volume of our speaker. The bottom layer will include a PWM LED controller (PCA9685), ten 10 ohm 805 resistors, five 47 ohm 805 resistors, two 2.2k ohm 805 resistors, one 0.1 uF capacitor, one 10 uF capacitor, one servo header, one speaker, two sensor headers, and an I2C header mount. Next, we route the designated air wires to their respected components. When routing, it is best to have the wires at a 45 degree angle and to use circle vias that are 0.3048mm in diameter. As you begin to route, you may come across wires that are causing conflict with another wire. This is where vias become useful because it will allow you to bypass that wire by entering another layer. It is always better use less vias as possible, but if necessary it is okay to place them in the preferred areas. In some cases, even creating vias won’t help when encountering conflicting wires. Another method of simple routing can be changing the orientation of a component. Initially, I placed the PWM IC horizontally, which cause the routing to become much more difficult; so in order to make my life easier, I simply rotated the orientation to portrait mode. As you can see in the PCB images, the rotating of the PWM IC proved to have a much cleaner and simpler routing of the wires. My initial PCB Layout is shown in Figure 1.
[/av_textblock]
[av_textblock size=” font_color=” color=”] Now to make the routings even simpler, do not bother routing the ground wires. Instead, add a ground plane to the top and bottom layers, this will allow the grounded wires to connect directly to the ground planes. The ground plane is shown in Figure 3.
[/av_textblock]
[av_textblock size=” font_color=” color=”] Now that the PCB is mostly complete, it is mandatory to run a Design Rule Check (DRC), this will check the PCB for any errors such as overlays and clearances. Since we are ordering the PCB from Oshpark, it is important to run the Oshpark DRC along with the default DRC to ensure that our PCB meets the requirements of the manufacturer. Furthermore, we added labels to our PCB to easily distinguish the components. How the actual board will look like is shown in Figure 4.
[/av_textblock]
[av_textblock size=” font_color=” color=”] Finally, I sent the PCB to my division manager, the customer, and the president for approval and purchase. Purchasing a stencil is not required, but it will make soldering SMD components easier to handle and cleaner.
[/av_textblock]
[av_textblock size=” font_color=” color=”] After creating the PCB, this changed how the Goliath would look like since the LEDs need to be displayed. This moved our design process forward.
[/av_textblock]
[av_textblock size=” font_color=” color=”] Requirement: The Goliath shall be a scale model of the Goliath 302 tank.
Our ENC has been working with Professor Hill in order to create a more detailed code to find the exact location of the biped. This caused us to change our design to meet certain criteria for the sensors.
[/av_textblock]
[av_textblock size=” font_color=” color=”]
For our hardware design, we made some important design changes in regards to the mounting of the sensors, the tracks and the wheels.
[/av_textblock]
[av_textblock size=” font_color=” color=”]
For the sensors, our goal was to find the ideal placement without compromising the size of the Goliath. In the images, we considered enclosing the sensors in the front top as shown in Figure 1.
[/av_textblock]
[av_textblock size=” font_color=” color=”]
However, the Goliath looked more like a frog compared to a tank. In order to try to keep the sensors enclosed within the body we made the Goliath bigger, shown in Figure 2.
[/av_textblock]
[av_textblock size=” font_color=” color=”]
However, after the customer saw how small our previous Goliath was, he wanted it to keep it around that size. This increased the Goliath’s size dramatically. As our electronics continued working on his code, we also found out that the sensors must be a certain distance apart in order for the code to work. If they are too close, the sensors would act as one sensor as opposed to two. The sensors ideal distance is about 4 to 6 inches apart. I tried to make another model with the sensors on the outside shown in Figure 3.
[/av_textblock]
[av_textblock size=” font_color=” color=”]
However, the sensors took away from the Goliath. Next, we considered an attachment bracket for the sensor that would clip onto the LG G2, but after speaking with the customer he wanted the sensor to be a part of the goliath and suggested it be hinged onto the front top panel. The sensor attached to the phone is shown in Figure 4.
[/av_textblock]
[av_textblock size=” font_color=” color=”]
After constant brainstorming, I realized that placing the sensor onto the front top panel was not going to work because there wasn’t enough space, so I suggested placing it onto the side panel. We used mini brass hinges for the sensor doors and for the opening of the top and bottom panels as shown in Figure 5.
[/av_textblock]
[av_textblock size=” font_color=” color=”]
We also changed the top panel now has an “X” support structure to ensure that the Goliath can withstand the forces applied by the LG G2, which can be seen with the static study. We added mounting holes for the bottom panel to connect with the side panels and used 2mm screws to secure its position. We added snap hook features to the top panel to secure the top with the rest of the parts when closed. The front of the side panel and sensor door also has an extruded 3mm circle with a rectangular bar, which is used to hold the sensor door open and keep it from swinging back and forth. The modeled version is shown in Figure 6.
[/av_textblock]
[av_textblock size=” font_color=” color=”]
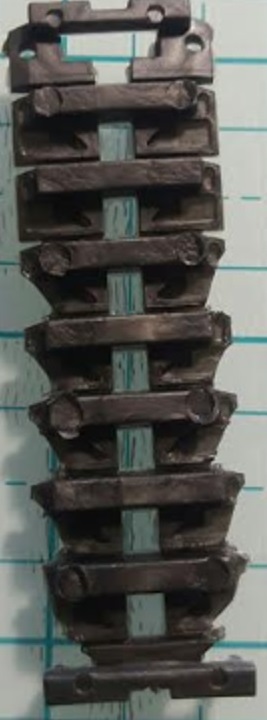
For the tracks, we initially 3D printed single track links to assemble and use for our Goliath tank. Unfortunately, the ABS 3D printed tracks were unreliable because it was fragile and did not provide the right traction that we needed, as shown in Figure 8.
[/av_textblock]
[av_textblock size=” font_color=” color=”]
Upon speaking with the customer about this concern, he suggested that we speak to Mike Pluma about printing the tracks with SemiFlex material. I considered this suggestion but later realized that the tracks would take up more print time, but we only had about half an hour remaining. This realization resulted in purchasing the Tamiya tracks and wheels set, which provided an all in one rubberized track that had enough traction and saved us from using any more of our print time. This meant that the dimensions in width had to change in order to compensate the width of the new tracks and sensor door. We increased the width by 0.75 inches and kept the length and height roughly the same. Since we would like to have the tracks look like the actual 302 Goliath, we chose to cut the Tamiya tracks and have it sport a more angled appearance as shown in Figure 9.
[/av_textblock]
[av_textblock size=” font_color=” color=”]
For the wheels, we decided to have the small wheels rotate instead of being idle. By doing so, we changed the design to a suspension-like appearance just as the actual 302 Goliath. The original Goliath suspension wheels are in Figure 10.
[/av_textblock]
[av_textblock size=” font_color=” color=”]
Overall, our CDR consisted of many changes to our design which allowed the design process to move forward. Implementing the sensor mounts and tracks will prepare us to achieve the mission objective and play the game.
[/av_textblock]
[av_textblock size=” font_color=” color=”] Requirement: Goliath shall use a 3Dot board connected to the custom PCB.
The purpose of having RGB LEDs is to give the direction and distance an object is away from Goliath this will be used for our custom PCB. In our case, that object we are tracking will be BiPed. RGB LEDs have four pins and connect via common anode or common cathode. Three pins are dedicated to the red, green, and blue. The last pin is used to ground or power the LEDs, dependent on the anode or cathode configuration. In our case, we are using a common cathode configuration where all 3 RGB pins are connected to a common source ground pin which will be the fourth pin. We will use the I2C I/O PWM Expander in order to control the LEDs and light them up in different configurations.
[/av_textblock]
[av_textblock size=” font_color=” color=”] We used the Adafruit PCA9685 Breakout Board to control the LEDs. First we connected the SCL and the SDA pins of the ultrasonic sensors to the breadboard which connects to the Arduino pins. Then we connected the SCL and SDA pins of the breakout board to the same position on the breadboard like the ultrasonic sensors. Next, we powered up both the sensor and the I2C expander using the 3.3V from the Arduino. After that, we needed to connect the RGB LEDs. The longest pin is the ground pin, so we grounded all of those pins, which is shown through using the yellow wires in the fritzing diagram. Next, we connected the the red, green, and blue pins directly to the breakout board, which are displayed via the PWM pins on the breakout board. The Fritzing Diagram is shown in Figure 1.
[/av_textblock]
[av_textblock size=” font_color=” color=”] The PCA9685 has a built in library named Adafruit_PWMServoDriver.h which we used to control the LEDs. First a user must run the initial setup in void setup loop.
[/av_textblock]
[av_textblock size=” font_color=” color=”] Then using the library, we can set the time the PWM pin is on or off by using the pwmSensors.setPWM(pin,time off, time on). The time on and time off must be a value from 0 to 4095, which represents the number of ticks to turn on and off. Moving on, for every direction, there are three conditions where we display a different color as stated previously. When the object is to the right, the two right LEDs will turn on. Therefore, we can turn on either the red, green or blue pins for the two right LEDs. For all of the other LEDs, we have to turn them off so they are not displayed when showing us the direction of the object. The code for the LEDs is shown below. Only the code for an object staying to the right is shown, the other code is repetitive and only the time on and off has to be changed. The variable da represents the distance from the object to the left sensor, db represents the distance from the object to the right sensor, and dm is the distance the object is away from the middle front of Goliath. We know that if da is greater than db, the object is to the right. If da is less than db, the object is to the right. Then if da is equal to db, the object is in the middle. Also, if dm is less than 50cm, we will turn on the red LED. If dm is between 50cm and 70cm, we will turn on the green LED. Finally, if dm is greater than 70cm, we will turn on the blue LED.
[/av_textblock]
[av_textblock size=” font_color=” color=”] By using the LEDs, we were able to determine the distance and the direction an object was at. The LEDs were accurate in detecting the object based on the readings from the sensors, and they can be used to help us troubleshoot our control algorithm to tell us what the sensors are seeing and how the motors are moving. It is a great add on feature to the Goliath project, and one which will help us in finalizing our control algorithm.
[/av_textblock]
[av_textblock size=” font_color=” color=”] Requirement: Goliath shall be a scale model of the Goliath 302.
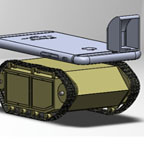
Our initial design did not meet our level one requirements of a six hour print time, thus some changes need to be made. The customer wanted to make the Goliath “as humanly small as possible,” where the electronic components are tightly fitted within the Goliath’s body. This smaller form factor forced us to change the scaling of the body and sub-components of the body including the wheels and tracks. Also, this meant we had to resort to smaller motors, sensors, and different placement of our smartphone. Instead of incorporating the smartphone into the Goliath’s body, we decided to have it placed on top of the Goliath. A double sided suction cup will be place on top of Goliath and the Android phone, as shown in Figure 1 and 2.
[/av_textblock]
[av_textblock size=” font_color=” color=”]
For our initial design, we based the dimensions of the body from our Samsung Galaxy S6, but for our redesign, we decided to base the dimensions off our 3DOT Board and newly selected motors. The 3DOT Board is roughly around 2.75 x 1.5 x 0.75 inches and the micro gearbox motor is measured approximately at 1.37 x 0.39 x 0.47 inches. With this information, we were able redesign the Goliath to be about 4.27 x 2.09 x 1.5 inches.
[/av_textblock]
[av_textblock size=” font_color=” color=”]
In comparison, our initial dimensions of 4.27 x 2.94 x 1.5 inches were very close in approximation with the ideal dimensions of 4.27 x 2.39 x 1.58 inches with a percent error of 0 x 23.01 x 5.06 %. These calculations are shown in Figure 3.
[/av_textblock]
[av_textblock size=” font_color=” color=”]
The width of our initial dimensions is larger than the ideal dimensions because we had to compensate with the placement of the micro gearbox motor. The size of the micro gearbox motor inside the Goliath is shown in Figure 4.
[/av_textblock]
[av_textblock size=” font_color=” color=”]
After figuring out the dimensions of our new design, I was able to 3D model the electronic components within the body of the Goliath. The 3DOT Board, micro gearbox motors, and last semester’s PCB are displayed tightly fitted inside the chassis.
[/av_textblock]
[av_textblock size=” font_color=” color=”]
Next, I modeled the Goliath with temporary tracks. The Goliath is modeled with an iPhone 6 and a periscope to mimic what our prototype will look like previously shown in Figure 2. The smartphone will be placed on top of the Goliath with the use of a double-sided suction cup. The suction cup will hold its position only if it is placed on a smooth surface. This resulted in changing the top panel design from an open surface to a closed surface. Also, since the design is in a much smaller form factor, the smaller wheels were changed from road wheels to idle wheels. I will have to perform a trade-off study to see how well idle wheels will work to move the tracks when compared to road wheels. Furthermore, the tracks and larger wheels will no longer be prefabricated since it will be harder to find and purchase small wheels. We will 3D print the wheels and tracks since the small form factor will greatly reduce print time.
[/av_textblock]
[av_textblock size=” font_color=” color=”]
The 3D modeling of the micro gearbox motors and temporary tracks were obtained from grabcad.com.
[/av_textblock]
[av_textblock size=” font_color=” color=”]
I created drawings on Solidworks to represent the different view angles, the parts involved in the chassis, and the electronic components within the chassis of the new design. The drawing provides an outline of the model and displays the labeled parts of the Goliath, shown in Figure 6, 7, and 8.
[/av_textblock]
[av_textblock size=” font_color=” color=”]
Rendering generates a life-like image of a 3D mode. We rendered using Photoview 360 to enhance the Goliath at maximum quality with a background image of an environment consisting of snow. This image used for our PDR title page showed in Figure 9.
[/av_textblock]
[av_textblock size=” font_color=” color=”]
We performed a static study, which analyzes stress, strain and displacement of force being applied to areas of the model. The static studies are shown in Figure 10, 11, and 12.
[/av_textblock]
[av_textblock size=” font_color=” color=”]
First, we did a back of the envelope calculation of the force applied from our smartphone to the top panel of the Goliath. We weighed the Samsung Galaxy S6, which was 4.87 grams and determined the acceleration of gravity of 9.8 meters per second squared. Force is equated to mass multiplied with acceleration, in which we calculated:
[/av_textblock]
[av_textblock size=” font_color=” color=”]
Second, we chose the material of our Goliath to be ABS plastic and applied the force of 1.35 N to the top panel, while the bottom wheels and panel were fixed.
[/av_textblock]
[av_textblock size=” font_color=” color=”]
Third, we analyzed the stress and strain, which is the change in shape of an object and came to a conclusion that the top panel became slightly bent and deformed at approximately 4.45e+004 von Mises.
[/av_textblock]
[av_textblock size=” font_color=” color=”]
Finally, the displacement analysis represents the change in position. The force applied changed the position of the top panel to be concaved. The deformation of the top panel is due to the kind of material used and the lack of support. For future studies, we will add ribs underneath the top panel to garner better support to withstand the force of the phone and to avoid any change in the structure.
[/av_textblock]
[av_textblock size=” font_color=” color=”]
Now that we have new dimensions and 3D modeled the Goliath, I was able to work with my division manager to find out the 3D print time of our model with the use of the Makerbot software shown in Figure 14.
[/av_textblock]
[av_textblock size=” font_color=” color=”]
For our first trial, we used the settings from the initial design, except we set the quality at low quality, while the rest of the settings were the same with a layer height of 0.20mm, 20% infill, raft, and 3 shells. The material we used was PLA with an extruder temperature of 230 degrees Celsius. The total print time was estimated to be about two hours and forty minutes. We were able to meet our level one requirement by a long shot when compared to our initial design. However, this first print did not meet our expectations due to its fragility and low quality, shown in Figure 15.
[/av_textblock]
[av_textblock size=” font_color=” color=”]
For our second trial, we decided to use a different printing material known as NGEN co-polymer instead of PLA and changed the print quality to standard. The total print time was estimated to be about four hours and forty-two minutes. This print was successful because it met the level one requirement and it produced a much sturdier quality than the first trial. The only issues that we came across was the extruded holes that were created in Solidworks were too small to fit our 3mm shaft for the drive wheels and that the side panel were too thin. Also, we did not consider fastening methods to connect the parts with ease and had to use tape to put the parts together.
[/av_textblock]
[av_textblock size=” font_color=” color=”]
For our future prints, we will increase the thickness of the side panel and combine the side panel and box panel to become one entity to ease fastening issues. We will increase the hole size for the wheels and create a fastening method to connect the panels without tape.
[/av_textblock]
The chassis parts for the full scale prototype needs to be connected in a functional matter:
As of now tape is being used to fasten the parts together
Possible solutions include redesigning the parts to incorporate hinges, snap hook features, micro screws, or 3D printing multiple parts as one entity with each part printing under two hours.
The subcomponents including the drive wheels, road wheels, and tracks of the Goliath:
The drive and large road wheels did not have correct hole dimensions, the 3mm steel rod could not fit into the wheels or side panels
Possible solutions include creating a bigger extruded hole
Perform tradeoff study for small road wheels vs. small idle wheels
Tracks are currently nonexistent for this prototype, due to the change in design we could not use prefabricated tracks and could not model our own tracks within the time frame of PDR
Possible solutions include 3D printing the tracks with flexible printing material and ensure the dimensions of the tracks are correct
Make sure tracks replicate the tracks of the actual Goliath
A tradeoff study between smartphones shall be performed due to failures in implementing the Samsung Galaxy S6 with the periscope in regards to producing a live feed for the Biped:
Smartphones that will be studied are the LG G2, iPhone 6 and Samsung Galaxy S6
With the height of the Goliath being at around 1.5 inches, the placement of the sensors will play a factor in detecting biped:
Depending on biped’s dimensions, our current Goliath model will only detict its legs
Possible solutions include placing the sensors at a certain angle so it can accurately track the Biped
Work with the electronics and control engineer to obtain PCB schematic in order to assemble and layout the PCB
[av_textblock size=” font_color=” color=”]
Overall, our preliminary redesign was successful in terms of our dimensions, 3D modeling, static studies, and prototyping. The small form factor proved to be a difficult challenge because we had to tightly fit each electronic component without sacrificing functionality. However, the small size helped us reach a total print time of four hours with about two hours left for additional prints such as the tracks. The tracks will be modeled and printed for our next prototype and more changes such as fastening methods, and thicker parts will be implemented. The static study helped us figure out the need for support for the top panel when a force of 1.35 N is applied, which we will remodel in the future. As for the prototype, we will use ABS material due to customer request and include further details in order to replicate the actual appearance of the 302 Goliath.
[/av_textblock]
[av_textblock size=” font_color=” color=”] Requirement: Goliath shall follow the Biped at a fixed distance of 20(up for debate with testing) inches with a margin of error of 15%.
From the rapid prototype, it was noted that the data from the ultrasonic sensors jumped from small values such as 50cm to larger values around 100cm. By having a jump in these values, the motors’ speed changed and it caused the Goliath to have a jerking motion. In order to have a smoother signal for more accurate measurements and movements, a running averaging filter was created.
[/av_textblock]
[av_textblock size=” font_color=” color=”] The idea of a running averaging filter consists of having an array of values, dependent on how big the user wants the filter to be. This array of sensor values will add the next data to its group and take out the latest data. Then it will average out the values in the array and produce an average number that is confined within the typical range of the datas. Thus, there will be less jump in the sensor values as the signal is smoothed. It should be noted that there is a pro and con to creating an averaging filter. First of all, by creating a larger array of data, the signal will be smooth to the point where a user is able to obtain linearity between data values. However, by creating this large array, the sensor is less prone to tracking an object that is moving at a fast rate accurately. Therefore, we created a 6 point running averaging filter.
[/av_textblock]
[av_heading tag=’h2′ padding=’10’ heading=’Steps to Writing the Algorithm’ color=’custom-color-heading’ style=” custom_font=’#ff6a00′ size=” subheading_active=” subheading_size=’15’ custom_class=”][/av_heading]
[av_textblock size=” font_color=” color=”]
Create an array to store the sensor’s data values and initialize all values to be 0.
Create an index to increment the pointer of the next data to be added and taken out.
Create a variable to hold the total value of the numbers in the array.
Create a variable to hold the average value from the array.
Take out the first data in the array from the total or where the index is pointing in the array.
Add the new value from the sensor data in the place of the previous value taken out and add it to the total.
Average out the values from the array by dividing the total by 6 or whatever the user selects for their averaging filter size.
Increment the index to select the next data in the array to be taken out.
If the index is larger than the averaging filter size, restart it at 0.
[av_textblock size=” font_color=” color=”] By creating this running averaging filter, we were able to obtain a smoother signal from the data and translate those data into speed values for our motors. From the experiment conducted using the running averaging filter, we noticed there was less of a jerky motion from the movements of Goliath. This proved that the filter was very useful in our application for tracking an object.
[/av_textblock]
[av_textblock size=” font_color=” color=”] Requirement: Goliath shall follow the Biped at a fixed distance of 20 inches with a margin of error of 15%.
In order to move Goliath autonomously, a control algorithm was created to enable Goliath to stay within the range of 20 inches from BiPed. The control algorithm takes the sensor’s data and controls the speed of the motors to allow Goliath to reach its set point at 20 inches away from an object. The control algorithm consists of a P, PI, or PID controller which helps to correct the error in reaching the object. The kp, ki, and kd constants represent the proportional, integral, and derivative constants respectively. In essence, the proportional constant helps to correct the error currently happening in the present. The integral term takes the information from the past and tries to correct the values so it can reach the set point sooner. The derivative term predicts what is going to occur in the future and correct the error and stabilizes it to reach the set point with less overshoot and a faster response time. For our case, we will be using a PI controller to automate Goliath’s movements.
[/av_textblock]
[av_textblock size=” font_color=” color=”] Before we can write the control algorithm, we first have to see how we are going to automate the motors’ speed from the sensors’ values.
[/av_textblock]
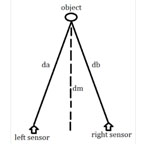
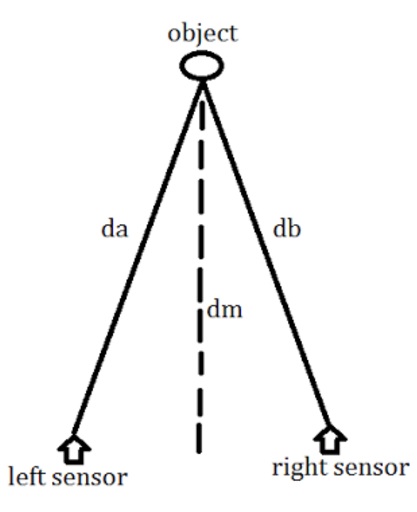
[av_textblock size=” font_color=” color=”] By drawing out the diagram of the sensor, we can see that the object is in the center between the two sensors. The distance from the left sensor to the object is da and the distance from the right sensor to the object is db. What we need to get is the distance from the object to the center between both sensors. This is shown in Figure 1.
[/av_textblock]
[av_textblock size=” font_color=” color=”] In order to get this value, we take the error (da-db), divide it by 2, and add it to db. This would give us the mean distance dm which will be the distance from the object to the center of Goliath between both sensors. The error in the distance edist will be equal to the set distance minus the mean distance dm. For our set distance dT, we are using 20 inches because this gives us a good field of view for our camera to record BiPed. Thus, our control algorithm will work to correct the edist error so we can reach the set point at 20 inches or 50 cm.
[/av_textblock]
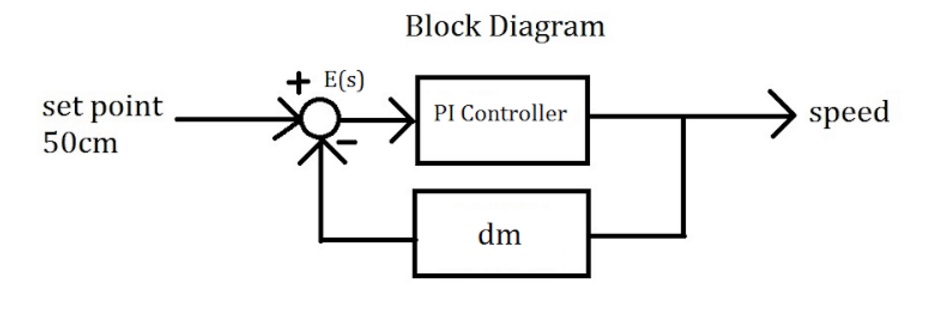
[av_textblock size=” font_color=” color=”] To control the speed, the PI controller will take the error and change the speed of the motors to make the error zero. When da is greater than db, that means the object is to the left. When db is greater than da, that means the object is to the right. When both da and db are equal, the object is in the middle. Thus, we are able to control the speed of each motor by setting a minimum speed that each motor will have to run through and adding or subtracting the mean speed m to the minimum speed based on the direction the object is at. If the edist is less than the set point, then the motors will have to go in reverse. When going in reverse, the speed control is exactly the opposite as going forward. For example, when Goliath is going forward and moving left towards the object, the speed of the left motor is slower than the speed of the right motor. When going in reverse and the object is to the left, the left motor is moving faster than the right motor, therefore creating a left turn facing the object. This can be sown in the block diagram shown in Figure 2.
[/av_textblock]
[av_heading tag=’h2′ padding=’10’ heading=’Steps to Writing an Algorithm’ color=’custom-color-heading’ style=” custom_font=’#ff6a00′ size=” subheading_active=” subheading_size=’15’ custom_class=”][/av_heading]
[av_textblock size=” font_color=” color=”]
Get the left sensor distance and store it under the variable da.
Get the right sensor distance and store it under the variable db.
Create a variable to store the error of (da-db)/2.
Create a variable to store dm which is equal to the error plus db.
Create a variable named edist to store values of the set distance minus dm.
Create kp and ki constants to tune the PI controller.
To find the proportional error, multiply kp by edist.
To find the integral error, create an if statement that will accumulate all of the errors from edist before the setpoint of 50cm is reached.
Next multiply the integral term by the ki constant to get the I in the PI controller.
The mean speed will be equal to P+I.
Create a minimum speed that each motor shall run on.
If the object is to the right and its distance is farther than the 50cm, move the left motor by setting it to the minimum speed plus the mean speed. The right motor will be the minimum speed minus the mean speed.
If the object is to the left and its distance is farther than the 50cm, control the speed of the motors opposite to step 12.
If the object is in the middle and its distance is farther than the 50cm, control the speed of the motors by adding the mean speed to the minimum speed.
If the object is to the left and its distance is less than the 50cm, change the speed of the left motor to the minimum speed plus the mean speed. The right motor will be the minimum speed minus the mean speed.
If the object is to the right and its distance is less than the 50cm, the motors speed are opposite of step 15.
If the object is in the middle and its distance is less than 50cm, control the speed of the motors the same as in step 14.
[av_textblock size=” font_color=” color=”] It should be noted that some lines of the code were taken out to shorten this length. Below is the important code where the control algorithm is created and how the motors’ speed are controlled. [1][2]
[/av_textblock]
[av_textblock size=” font_color=” color=”] The control algorithm was a useful tool in helping Goliath move autonomously. It was able to track an object very slowly, however, this can be fixed by adjusting the minimum speed, kp, and ki constants. We chose our minimum speed to be 90, our kp to be 3, and ki to be 0.5. It should be noted that we performed this control algorithm on the previous Goliath model meaning that these values will change because the new model is a different system. The new model’s constants will have to be fine tuned so they are able to track an object accurately. In conclusion, the control algorithm helped us in eliminating the jerking motion we previously encountered during our first prototype. We will be graphing the data from the sensors to see if the sensors are able to actually detect an object effectively, and we will be able to determine if a “bang-bang” system will be better to use than our current control algorithm.
[/av_textblock]
[av_textblock size=” font_color=” color=”] Requirement: Goliath shall be completed by Wednesday, December 14, 2016.
As project manager, we have to generate a schedule and burndown in order to keep track of your group. Tasks need to be delegated accordingly and at understandable rates. I would recommend looking at other groups work breakdown structure and schedule to get a feel of how things are broken down in the schedule. This schedule was created mid semester, and I would highly recommend to making it earlier in order to have more wiggle room and learn to adjust using the schedule to delegate responsibilities. It is harder to do than it sounds.
[/av_textblock]
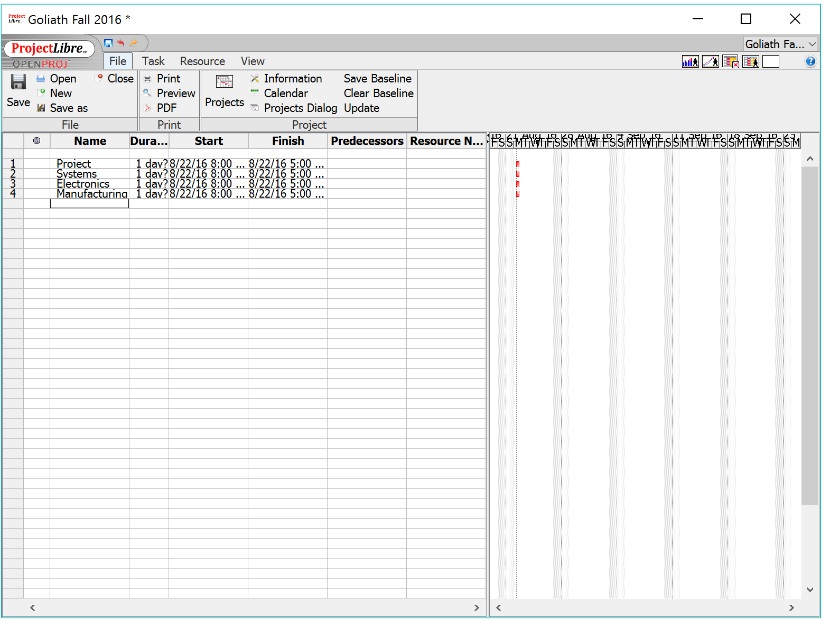
[av_textblock size=” font_color=” color=”] Using the generic schedule provided on Professor’s Hill’s website, I jotted down ideally when each task should be finished and how long it should take [1]. It is ideal to schedule things more in advance and leave some wiggle room just in case anything happens. I used Project Libre in order to create my schedule. I downloaded it the program from the following link [2]. After downloading it and opening the program, the program will display the following in Figure 2.
[/av_textblock]
[av_textblock size=” font_color=” color=”] I created a new project and entered the following data. The start date was set to the first day of class for 400D as shown in Figure 3.
[/av_textblock]
[av_textblock size=” font_color=” color=”] After pressing “OK”, I inputted all the positions into the name column as shown in Figure 4.
[/av_textblock]
[av_textblock size=” font_color=” color=”] Looking at a WBS, I inserted all the titles for each box in the corresponding places. I did this by first inserting a row. In order to do so, I clicked the box where I wanted to enter the new row. In tabs, I clicked “Tasks”. In the “Tasks” box I pressed “Insert”, the button with the green arrow next to it. This is shown in Figure 5.
[/av_textblock]
[av_textblock size=” font_color=” color=”] If too many rows were added, press the row to be removed and press the “Delete” button, which is under the “Insert Button”. I inserted the number of rows equivalent to the number or box titles I had for each person and typed in the titles. In order to show that the following title of tasks were for the designated person, I used the indent tool, which can be found in the “Task” tab in the “Task” box next to “Insert” button. This is shown in Figure 6.
[/av_textblock]
[av_textblock size=” font_color=” color=”]
Under the generalized title for tasks, I added the number of rows equivalent to the number of tasks in that section. I also indented these tasks as shown in Figure 7.
[/av_textblock]
[av_textblock size=” font_color=” color=”] I proceeded to do it this til all tasks are on Project Libre for each member. To set the dates I double clicked the the tasks, which opened a window shown in Figure 8.
[/av_textblock]
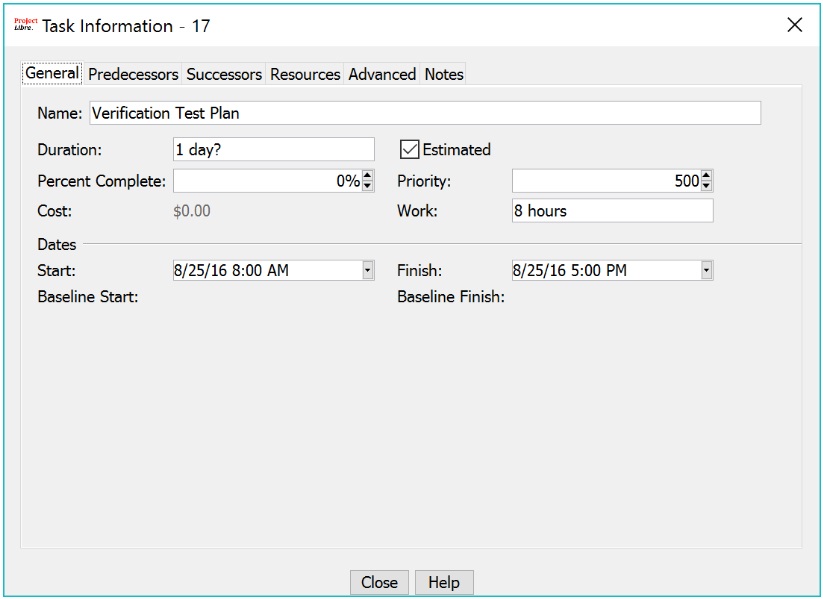
[av_textblock size=” font_color=” color=”] I changed the start date and finish date to the proper times. This is done for all tasks. There is no need to do it for the title’s of the tasks since Project Libre does it automatically. Each meeting I had with my group, I asked for the status of their project in order to enter the percent complete, which is in the Task Information as shown in Figure 8 above. In order to show my critical path I used predecessors to show the task that needs to be completed before that task is completed. For example, the PPP line 10 first has to complete the PDD in line 9. The predecessor would be line 9. This is shown in Figure 9.
[/av_textblock]
[av_textblock size=” font_color=” color=”] In order to add names next the tasks. I went to the “Resource” tab and in the “Views” box pressed “Resources”. In the name column, I enter the names of the task or the person completing it. To show our critical path, I only added the task names of the tasks within the critical path. Our schedule can be found in this link. Link to Download Schedule
[/av_textblock]
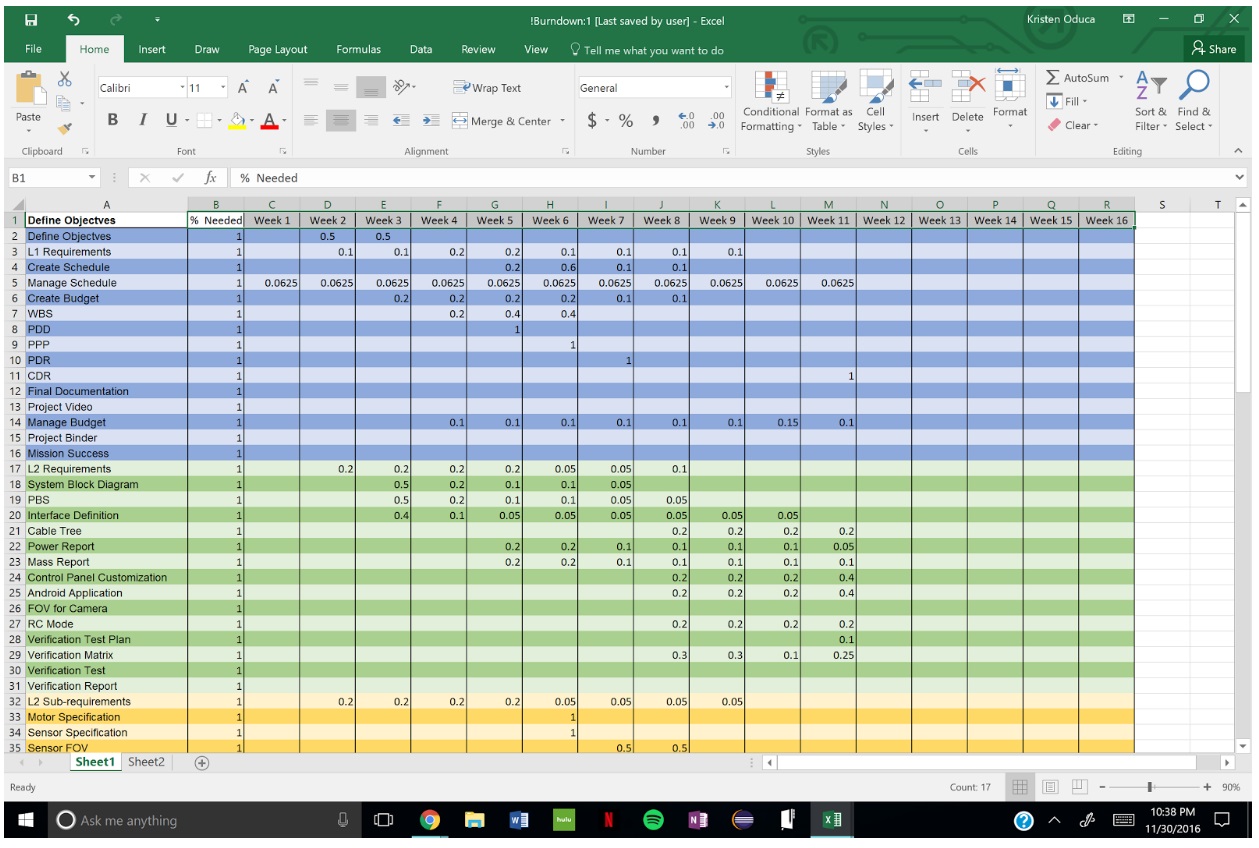
[av_textblock size=” font_color=” color=”] I used Excel to create the burn down. In Column A I entered all the tasks to be completed. In Column B I entered the percent to be completed for each tasks. In Row 1, I put the total amount of weeks we have in the semester. Each week, I documented the percent completed for each task. Figure 10 shows an example.
[/av_textblock]
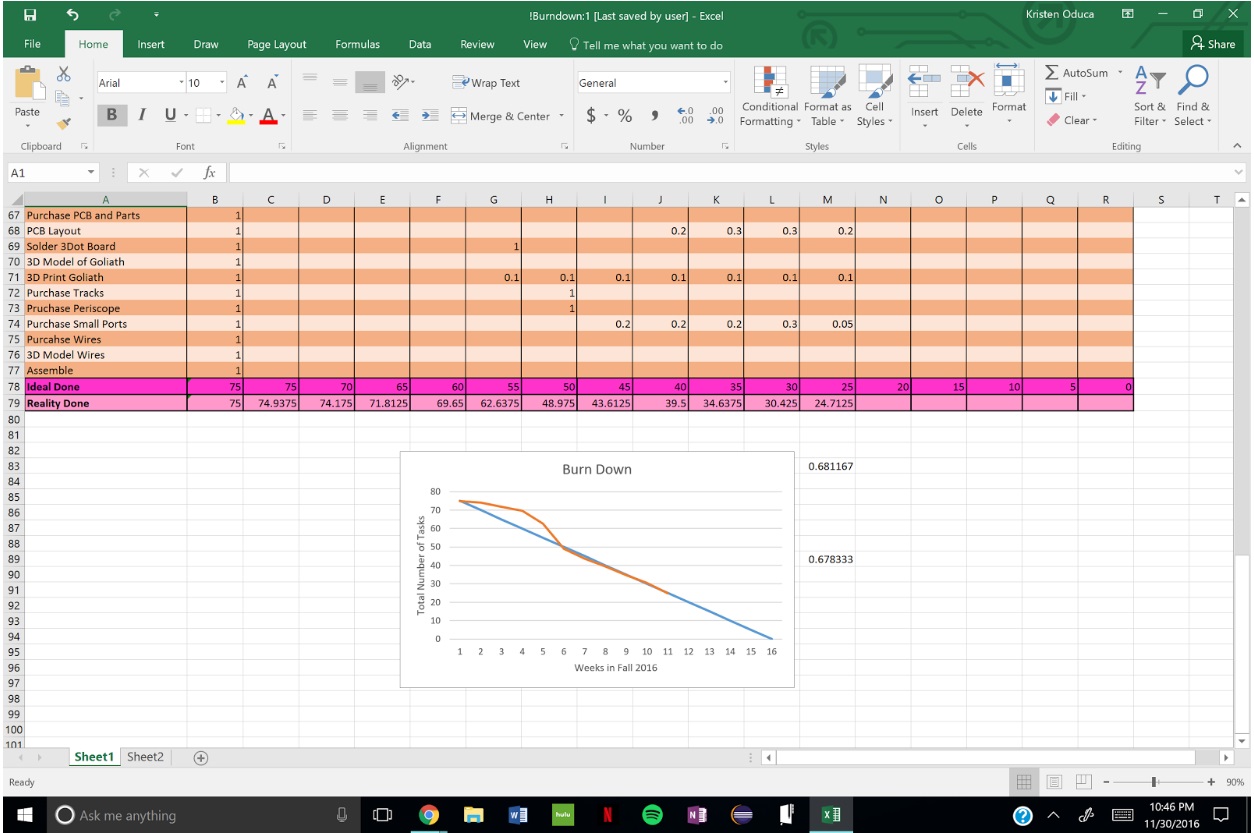
[av_textblock size=” font_color=” color=”] At the bottom, I made two rows for the total number of tasks, one is ideal and one is reality. In the ideally done row, I took the total number of tasks and decremented it evenly over the span of the total of weeks. For the reality done, I summed up the task percentage for each week. In other words, I summed up each column. I highlighted both rows and graphed them on excel. This can be seen in Figure 11.
[/av_textblock]
[av_textblock size=” font_color=” color=”]
When using the schedule and burndown to keep track of tasks, it is important to constantly update it and the status. There have been several times where we thought we were done with a task, but after to talking to Professor Hill, he thought a better way to implement the task that was “complete”. Also, there are times when new features are added to your project. In my opinion, each task duration should be the maximum amount of time you think it would take to complete the task, but scheduled in a way that completes the project a few weeks before it is due to leave room for unpredictable situations.
[/av_textblock]
[av_textblock size=” font_color=” color=”] Requirements: Goliath will be the “eyes” for the Biped by providing a live video feed of the game.
To provide a live video feed, are using the 3Dot board and the Arxterra App and Control Panel camera feed. Below are instruction on how to log into the application and panel so that the same user can connect the camera and computer through wifi.
[/av_textblock]
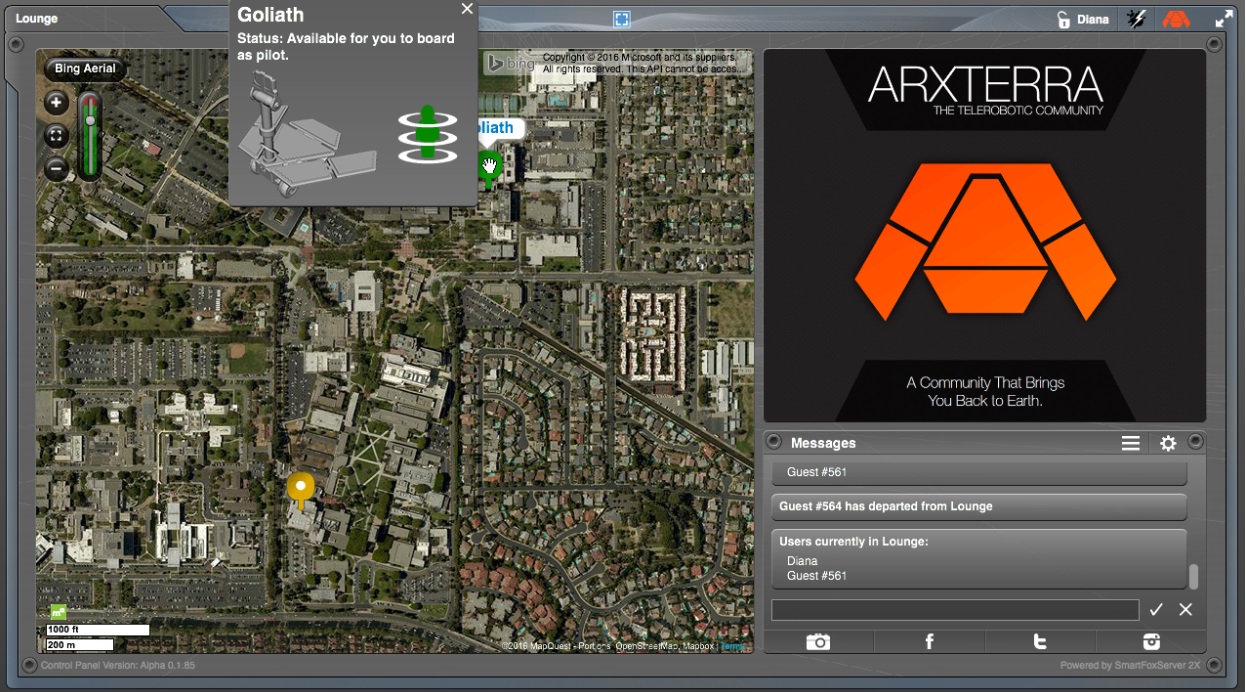
[av_textblock size=” font_color=” color=”] For live streaming Goliath will be using the Arxterra App and Arxterra Control Panel. We used a phone and a computer. Both Goliath and Biped will both have access to the video feed and be able to message each other. The Arxterra Control Panel can be accessed here (http://cp.arxterra.com/#). Clicking this link will give you the image in Figure 1.
[/av_textblock]
[av_textblock size=” font_color=” color=”] On this page the user will be able to input a login name and password. It is only necessary to input a name. However, it is still necessary to remember the name in order to use the same name on the Arxterra Application.
[/av_textblock]
[av_textblock size=” font_color=” color=”] On the App click on the icon next next to the camera icon which allows the user to pick a control mode. In order to activate the camera feed, “Community” was selected from the drop down menu. This then takes you to the login page. On this page, we entered the robot’s name and enter the same name for the pilot that was used in the Control Panel. If two people want to share the Control Panel, put a comma in between the names. Once logged in, we clicked on the camera icon. This shows a switch for the monitor. To turn the camera on, we clicked the switch. This is shown in Figure 2 below.
[/av_textblock]
[av_textblock size=” font_color=” color=”]
The robot is now activated. The user can go “on-board” the robot on the Control Panel. Going back to the Control Panel the robot is located on the map as a green push pin. Click on the pin and click the human figure to go “on-board” the robot shown in Figure 4.
[/av_textblock]
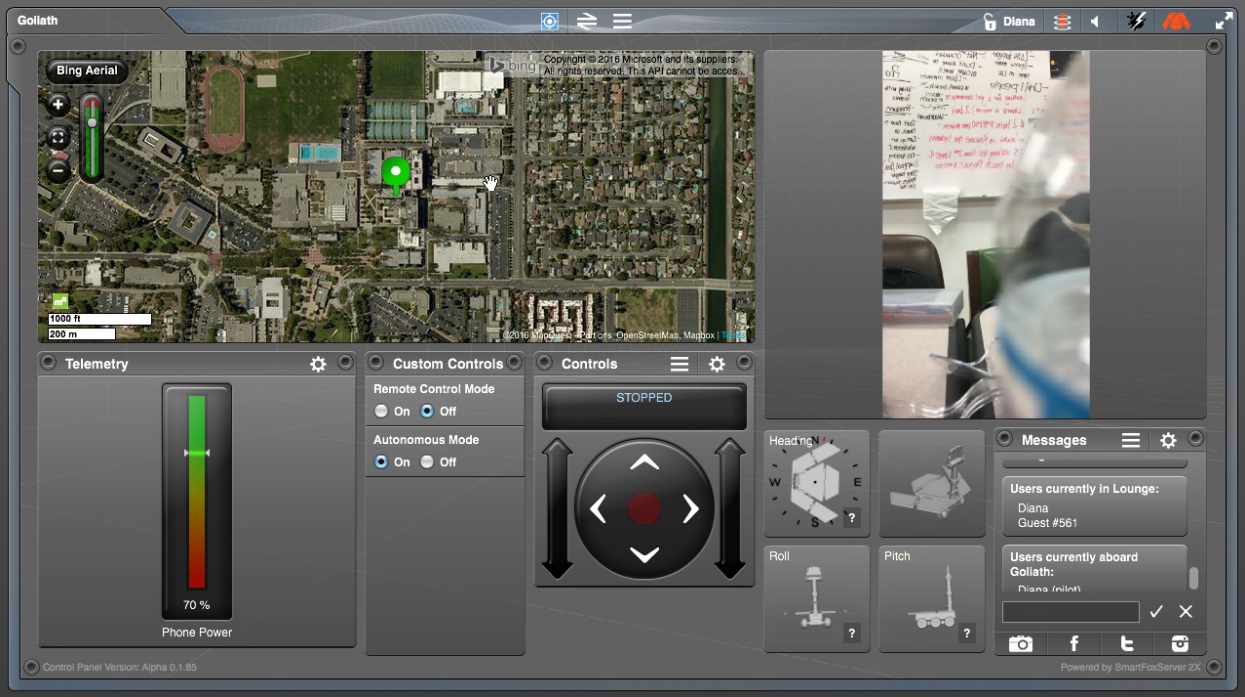
[av_textblock size=” font_color=” color=”] Once on board the user can view the camera feed and different setting about the robot. Here the user can see telemetry and custom controls. In addition, if multiple people are on-board the same robot they can communicate with each other though the built-in chat. Figure 5 shows a screenshot of a user “on-board” a robot.
[/av_textblock]
[av_textblock size=” font_color=” color=”] Now we are able to view our camera feed from the the same of different user. Multiple people can be onboard a same robot and chat with each other in the message box. With connecting through wifi there is no telemetry or custom commands
[/av_textblock]
[av_textblock size=” font_color=” color=”] Requirement: Goliath shall follow the Biped at a fixed distance of 20 inches with a margin of error of 15%.
In order for Goliath to run autonomously, two rapid prototype models were created using different sensors. The first model was created using the ultrasonic HC-SR04 ultrasonic sensors as shown in Figure 1. The second model was created using Sharp GP2Y0A60SZLF Analog Distance Sensors as shown in Figure 2.
[/av_textblock]
[av_textblock size=” font_color=” color=”] The two models were tested and compared with one another to determine their capabilities in tracking an object accurately. This also works as an experiment to determine, which would be better for our project.
[/av_textblock]
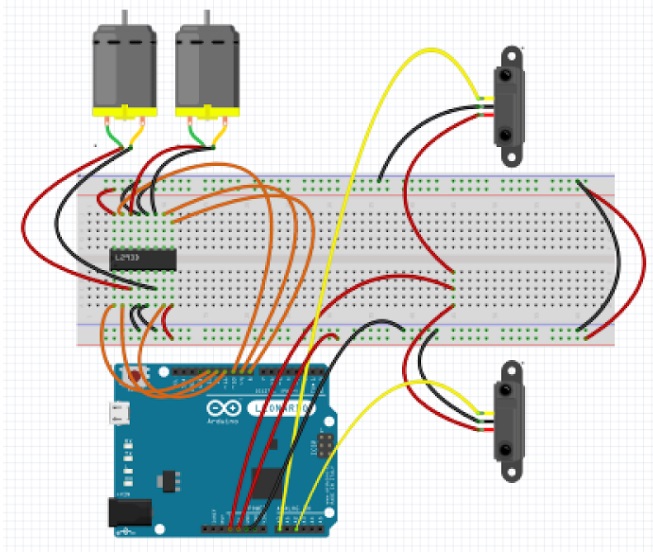
[av_textblock size=” font_color=” color=”] First, we took the previous Goliath and removed its custom PCB and 3DoT board. Next we attached a breadboard and an Arduino Leonardo to the top of the Goliath. We did not use a 3Dot board because at the time there was an issue uploading the library onto the board. A 5V battery pack was attached to the inside body to provide power to the motors and to the sensors. We used a L293D H-Bridge Dual Motor Driver IC to control our motors based on the feedback from the sensors. To connect the L293D IC, pins 4, 5, 12, and 13 are grounded. Pins 8 and 16 are connected to the 5V source. Pin 1 and 9 are connected to the digital pins from the Leonardo to enable the motor driver to turn on. Pin 2 and 7 are connected to the digital pins of the Leonardo to control motor A. Pins 10 and 15 are the connected to the digital pins of the Leonardo to control motor B. Finally pins 3,6,11, and 14 are connected to the motors. This is shown in Figure 3. Now that we have a platform to set up our sensors to, we tested the ultrasonic and IR sensors. This is shown in Figure 3.
[/av_textblock]
[av_heading tag=’h2′ padding=’10’ heading=’Code to Control the Motor’ color=’custom-color-heading’ style=” custom_font=’#ff6a00′ size=” subheading_active=” subheading_size=’15’ custom_class=”][/av_heading]
[av_textblock size=” font_color=” color=”] In order to set up the code to control the motors, there will be five scenarios that we will face.
If the Goliath is too far from the tracked object, the motors will both rotate forward to allow Goliath to move forward.
If the Goliath is within a the range from the tracked object, the motors will turn on and Goliath will come to a stop.
If the Goliath is too close to the tracked object, the motors will both rotate backwards to allow Goliath to move in reverse.
If the left sensor detects the object is closer than the right one does, the right motor will rotate forwards while the left motor is left stationary, thus creating a left turn.
If the right sensor detects the object is closer than the left one does, the left motor will rotate forwards while the right motor is left stationary, thus creating a right turn.
These five scenarios are the basis for the functions we will call to after receiving the distance from both sensors. Below is the the Arduino code for setting up the motor controls.
[/av_textblock]
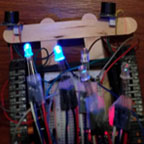
[av_textblock size=” font_color=” color=”] Each HC-SR04 Ultrasonic Sensor has 4 pins: Vcc, Trig, Echo, and Gnd. The Trig pin is used to transmit the sound waves while the Echo pin is used to receive the reflected sound. We tied the two ultrasonic sensors to the front of the Goliath with rubber bands, and connected the Trig and Echo pins to the digital pins of the Leonardo. To code the ultrasonic sensors, we first must perform a digitalWrite to set the trigger pins low. Then after a delay of 2 microseconds, we set the trigger pins high and wait 10 microseconds to reset the trigger pins back to low. From this situation, we can perform a pusleIn function on the echo pins to detect the amount of time it takes for the sound wave to be transmitted and reflected back. Then we divide this time by 58.2 to get the distance the object is away in cm [1]. By performing this action on both sensors, we can compare the two sensor values to move the Goliath. Figures 4 and 5 below show the Fritzing Diagram and Breadboard Photo for the ultrasonic sensors. Attached to the bottom of this blog post is the code implemented using the ultrasonic sensors.
[/av_textblock]
[av_heading tag=’h2′ padding=’10’ heading=’Implementing the Sharp IR Sensors’ color=’custom-color-heading’ style=” custom_font=’#ff6a00′ size=” subheading_active=” subheading_size=’15’ custom_class=”][/av_heading]
[av_textblock size=” font_color=” color=”] Each Sharp IR Sensor have 4 pins: EN, OUT, VCC, and GND. EN is not connected to any pins, while VCC and GND are connected to the positive 5V and ground terminals of the breadboard respectively. The OUT pin is connected to the analog pin of the Leonardo, which gives voltage readings from 0 to 5V based on the distance an object is detected. The Sharp sensor has an integrated signal processor implemented into it, and can be powered from a 3 to 5V source. We taped the IR sensors to the front of the Goliath, and connected its pins to the power terminals and the analog pins of the Leonardo. After this process, the code was written to follow an object [2][4]. Because the analog pins detect voltage ranges, we have to find a way to convert the voltage readings to distance measurements. Figures 6 and 7 below show the Fritzing Diagram and Breadboard Photo for the Sharp IR sensors. [3]
[/av_textblock]
[av_textblock size=” font_color=” color=”] From the data sheet, we notice there were no linear relationship between the voltage and distance. [5]
[/av_textblock]
[av_textblock size=” font_color=” color=”] In order for the sensors to work accurately, an equation must be used to determine the relationship between the voltage readings and the distances. By doing a search online, we found a suitable equation so we can test our sensors. The equation is shown in Figure 9.
[/av_textblock]
[av_textblock size=” font_color=” color=”] Now that we were able to determine the distance an object is detected, we compare the two sensor values and moved our motors based on the the movement of the object. Attached to the bottom is the code implemented with the Sharp IR Sensors.
[/av_textblock]
[av_heading tag=’h3′ padding=’10’ heading=’Code for the Sharp IR Sensors’ color=’custom-color-heading’ style=” custom_font=’#ff6a00′ size=” subheading_active=” subheading_size=’15’ custom_class=”][/av_heading]
[av_textblock size=” font_color=” color=”] From the test of both prototypes, we noticed that the ultrasonic sensors were more reliable in tracking an object. Both sensors were able to turn as the object turned, however, sometimes the prototype implemented with the IR sensor would track a wall or something else and follow that object instead. We noticed that the measurements from the IR sensors were distorted due to the level of light coming from the sun and the light bulbs in the room. Because the ultrasonic sensors used sound waves, its signals were less prone to distortion from outside sources. This resulted in better movements and trackability. Also, there were jitters in the movement of the Goliath which was caused by the unstable measurements from the sensors. The code will be refined and will need to be implemented with a control algorithm and an average summing filter to smooth out the input signals.
[/av_textblock]
[av_textblock size=” font_color=” color=”] From the test of the prototypes, the ultrasonic is the most ideal sensor to use for our application. It tracked objects better than the IR sensor, and its signals had less distortion. These prototypes showed a proof of concept that Goliath should be able to track an object autonomously using only two sensors. The code will need to be refined to improve the jitters noticed from the tests.
[/av_textblock]
[av_textblock size=” font_color=’custom’ color=’#ff6a00′]
Source Material
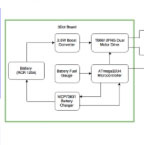
[av_textblock size=” font_color=” color=”] The system block diagram illustrates how the different components of each system interact with each other. From the Diagram as shown in Figure 1 you can see that our phone and computer are a separate system from the 3Dot board since they are not necessary have the Goliath to be autonomous. The phone system is a periscope connected to the phone’s camera while it is on producing a live feed on the Arxterra Control Panel.
[/av_textblock]
[av_textblock size=” font_color=” color=”] However, if you look at the block diagram you can see our 3Dot board block is different. That is because we did not use all the components of the 3Dot therefore only the components that we will be using are included on our system block diagram. One of the main things component we did not use was the Bluetooth v4.0 BLE Transceiver since we will not be operating in remote control (RC) mode.
[/av_textblock]
[av_textblock size=” font_color=’custom’ color=’#ff6a00′]
Source Material
[av_textblock size=” font_color=” color=”] The software design is a project document that illustrates the the inputs and outputs intact with the microcontroller. As stated in the previous section, our 3Dot board does not have a bluetooth module since we will be autonomous and do not need to use RC mode. Because we don’t have a bluetooth module Goliath can not send telemetry. In addition, we are going to be an autonomous vehicle. This means we will not be sending commands to the robot.
[/av_textblock]
[av_textblock size=” font_color=” color=”] Goliath has two input, the two following sensors, which are analog and need to be converted to digital. This is shown in Figure 3, Goliath’s software block diagram.
[/av_textblock]
[av_textblock size=” font_color=” color=”] In the guidance block we will be looking at two aspect, how far away the Biped and what location of the Biped from Goliath. From this we can calculate the speed and direction that the Goliath needs to go. With this information we can determine the speed we need to turn for each motor.
[/av_textblock]
[av_textblock size=” font_color=” color=”] The interface definition design is used to map out all the pins of the components of Goliath as shown in Figure 4. The components we pinned out are the motor driver, LiPo charger and follower sensor.
[/av_textblock]
[av_textblock size=” font_color=” color=”] We can find out where these pins are from the ATmega 32u4 to the different components and and how they are connected from the 3Dot board schematic as shown in Figure 5. The only connections that are not made on the 3Dot board would be the connections for the following sensor.
[/av_textblock]
[av_textblock size=” font_color=” color=”] The resource report looks at our allocated budget, mass, and power for our project. This helps us plan and estimate what we may be looking at if we go through with our project.
[/av_textblock]
[av_textblock size=” font_color=” color=”] The resource report looks at our allocated budget, mass, and power for our project. This helps us plan and estimate what we may be looking at if we go through with our project.
[/av_textblock]
[av_textblock size=” font_color=” color=”] The mass report looks at the potential components that will be contributing to the Goliath’s weight when it is active. We have access to some of the components and have actual measured values to them as shown in chart in Figure 7.
[/av_textblock]
[av_textblock size=” font_color=” color=”] Lastly, the power report looks at how much current our project potentially has and how much the current components will be taking up as shown in the chart in Figure 8. The project allocation for power comes from the rating of the 3.6v 650mAh Li-Ion battery that we will be using to power the 3Dot board.
[/av_textblock]