Color Sensor Trade Study (With Cloth Maze)
By: Matt Shellhammer (Electronics & Control Engineer)
Approved by: Lucas Gutierrez (Project Manager)
Introduction
This trade study is a follow on study to the color sensor trade study which simply investigated the ranges at which the colors using electrical tape (vinyl) would be detected using the TCS34725 color sensor. In this trade study I borrowed the cloth maze from The Robot Company to run testing on it with the TCS34725 color sensor. The goal of this trade study is to help give the projects an idea of where exactly on their robots the color sensor should be mounted. Or the development team of the color sensor PCB where the color sensors should be mounted on the PCB.
Methodology
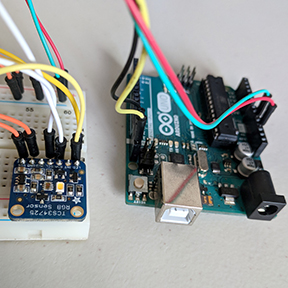
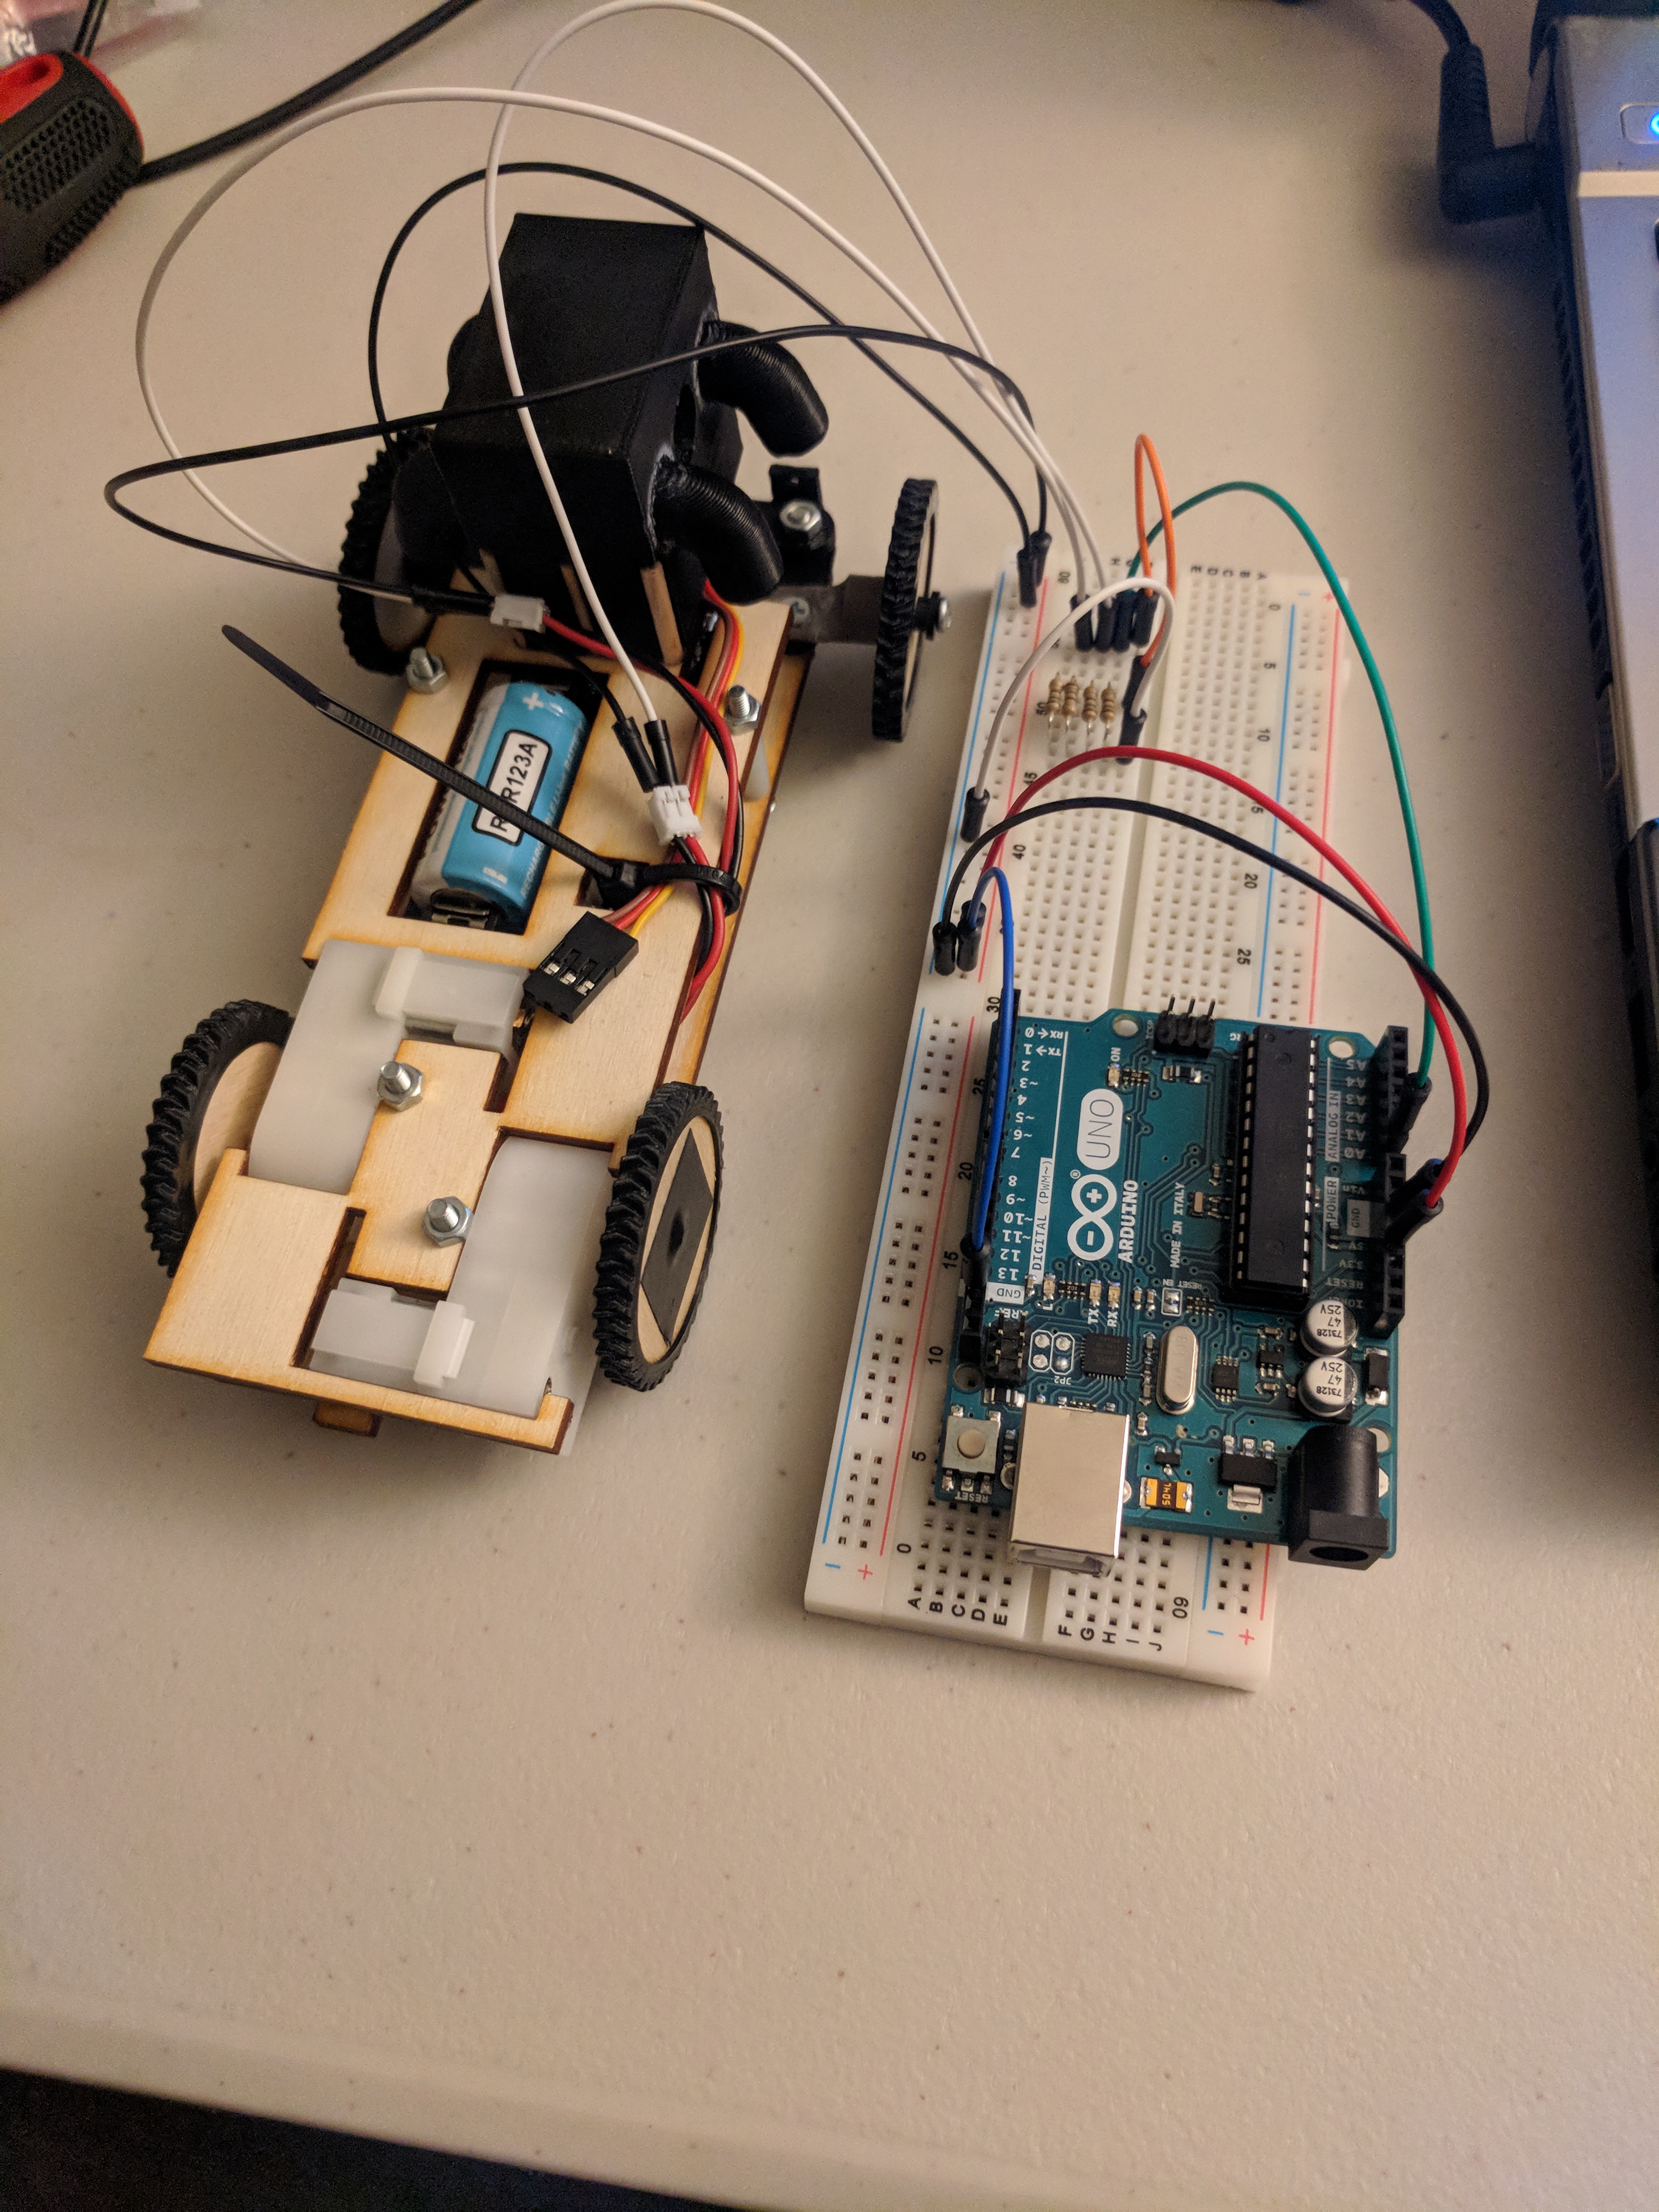
In this trade study I used two devices, the Arduino Uno, and the TCS34725 color sensor. I connected the color sensor to the Arduino Uno in the configuration shown in the table below. Additionally, to read the values from the color sensor I2C communication was used. To implement this communication the Adafruit Arduino I2C communication library was used, this library is available online on the Adafruit website.
Table 1: Interface Matrix
|
Arduino Uno pins |
TCS34725 Color sensor pins |
| Vcc (3.3v) | VIN |
|
GND |
GND |
| SDA (pin18) | SDA |
| SCL (pin19) | SCL |
This experiment was configured similar to the original color sensor test, however the color sensor was instead this time held above the cloth maze. A piece of paper with measurement tick marks was then placed next to the maze to measure the distance from either the side of the color sensor or the distance away from the color sensor. This piece of paper was used since rulers have a gap between the beginning of the measurements and the end of the ruler, and in this experiment the measurement had to start at the maze (not above it). The paper ruler is shown below.
Figure 1: Paper ruler used to measure vertical and horizontal distance.
Now using the maze I tested the three colors on the maze: white, green, and brown to determine the optimal vertical distance (distance away from color sensor). I did this by determining where I got a peak measurement and then called that the optimal distance for that color. I also measured at what distance there was detection and at what distance there was significant detection. Significant detection is defined as reading a value greater than 1000 for any of the RBG values. The maze used is shown below and the results of the experiment are below the figure.
Figure 2: Section of the maze used showing the white, green, and brown used.
Table 2: Color and Distance Detection (Part 1)
| Color Detecting |
Detection distance |
Significant detection distance (RGB values over 1000 recorded) | Distance where max value achieved |
| White | 8.9 cm | 2 cm | 1 mm |
| Brown | 4.7 cm | 0.5 cm | 3 mm |
| Green | 6.1 cm | 1.6 cm | 2 mm |
After this test was preformed another test was performed to determine the optimal horizontal distance for the color sensor. This distance is more subjective since you want to be far enough away from the sensor to not always be detecting the lines however you don’t want the response time of your robot to be too slow. For this test I measured two distances for each color, I measured the point the color is detected as well as the point at which the amount of detection significantly spikes. The origin or zero value would be in the middle of the color sensor. I then did this from the left and the right side of the color sensor, the left and right side of the color sensor is defined as follows. In this test the color sensor was placed at 1 cm away from the maze using a stack of post it notes to elevate the sensor above the maze. I did this test only for colors green and brown because white isn’t relevant for our particular applications.
Figure 3: Test setup to show which side would be the right side of the color sensor vs which is the left.
Table 3: Color and Distance Detection (Part 2)
| Color Detecting | Detected horizontal distance (Top) | Detected horizontal distance (Bottom) | Detection spike horizontal distance (Top) | Detection spike horizontal distance (Bottom) |
| Brown | 1.2 cm | 1.4 cm | 3 mm | 3 mm |
| Green | 1.3 cm | 1.3 cm | 5 mm | 5 mm |
Conclusion
What can be inferred from this trade study is that a vertical distance from the color sensor within a range of 1 cm to 1 mm is a suitable range. Overall, it appeared to be that the closer to the maze (vertically) the stronger your reading would be. Additionally as long as the color sensor is at least a horizontal range of 3 to 5 mm away (zero being the center of the color sensor) from the lines there will not be any significant unintentional readings. However if trying to ensure no detection when driving straight, a distance of 9-10 mm might be desired. Testing with the project specific robot and software will also be an important factor when deciding the layout and placement of the color sensors. This trade study is to be used in supplement with testing to give the engineers a good starting point when designing the color sensor layout.

