Improvements to the Bioprinter

By Ali Etezadkhah – Project Manager

While were able to print structures that were well within our stated tolerances, the process is cumbersome at the moment.  There are several features that are missing from the current design, most of which can be easily added to the printer.

  1. The aluminum printing plate is too thin and lacks rigidity.  We were unable to tightly fasten it to the cooler because of its thinness.  As an added bonus, a thicker plate has more heat capacity and will serve to limit temperature fluctuations.
  2. There is no mechanism to level the plate at this time.  A level plate is an absolute necessity for any type of 3D printing.  This can be easily done by fastening the new plate in 3 places.  It only takes 3 points to define a plane and it is far easier to level a plate with 3 screws and springs.
  3. There is no mechanism to easily adjust the height of the nozzles.  Next to the levelness of the plate, the distance between the nozzle and printing plate is also very important.  If the nozzle is too far, the gel won’t stick to the plate and if it’s too close, the flow of gel is blocked.  Ideally the distance should be 0.1 mm, about the thickness of a sheet of paper.
  4. The extruder housing needs to be redesigned with a larger whole on the bottom.  Since we added heating resistors to the dispensing needle, the syringe can no longer be taken out without removing the dispensing needle.  With a larger whole, it will be far easier to fill the syringe.

We would like to thank the Electrical Engineering Department, Biomedical Department, Mr. Gary Hill, Mr. Larry Harmon, Dr. Maryam Moussavi, Dr. Christopher Druzgalski, Mr. Darshit Makawana, and last semester’s biomedical project team for helping us take this project to the next level.

Tolerance of 3-D BioPrinter

By Omair Tariq, Systems and Test Engineer

Purpose

The purpose of this blog post is to determine the tolerance of our 3-D Bioprinter. Our level 1 requirement was that the printed object’s measurement should be within 0.7 mm of the value specified in the 3-D model of the object.

Equipment Needed


Equipment

Quantity

3-D BioPrinter

1

Vernier Caliper

1

2% agarose, 4% starch solution

50 ml

Laptop with Slic3r and Pronterface Installed

1

USB Cables

2

Table 1. Equipment needed for accuracy testing


Perimeter

Value

Nozzle diameter (20 gauge needle inner diameter)[1]

0.6mm

Filament Diameter

29mm

Travel Speed

20 mm/s

First Layer Speed

10 mm/s

Fill Density

1

Fill Pattern

Rectilinear

Top/Bottom fill pattern

Rectilinear

Perimeter Speed

20 mm/s

Small perimeters

20 mm/s

External Perimeters

20 mm/s

Infill

20 mm/s

Solid Infill

20 mm/s

Top solid infill

20 mm/s

Support Material

20 mm/s

Bridges

20 mm/s

Gap Fill

20 mm/s

All Acceleration Controls

0 mm/s2

Table 2. Slic3r Settings used for test print

Procedure

1.)    A 20mm x 20mm x 5mm block was printed using the BioPrinter.

Untitled-1

Figure 1. A 20mm x 20mm x 5 mm cube

2.)    It’s dimensions were then measured using a Vernier Caliper.

l = 19.85 mm (0.15mm within value specified in 3-D Model)

w = 19.97 mm (0.03 mm within value specified in 3-D Model)

h = 5.12 mm (0.12 mm within value specified in 3-D Model)

2

Figure 2. Length of 3-D Printed Cube

3 

Figure 3. Width of 3-D Printed Cube

4

Figure 4. Height of 3-D Printed Cube

Conclusion

The printed part’s length, width, and height were well within the expected range. Based on a single measurements from a single part printed in this procedure, the x-axis has a tolerance of 0.15 mm , the y-axis has a tolerance of 0.03 mm and z-axis has a tolerance of 0.12 mm. This leads us to the conclusion that the printer has clearly met the level requirement of the values being within 0.7 mm of the specified values. In an ideal world, the tolerance would be specified after taking measurements from hundreds of printed parts and the tolerance values averaged. 

Watch a video of the BioPrinter:
https://www.youtube.com/watch?v=0oLHkA7AWBw

Fine Tuning the Printer

By Omair Tariq, Systems and Test Engineer

Scope

There are two issues to ensure correct flow of the mixture: Volume and Temperature Control of extrusion apparatus. The extrusion apparatus consists of a syringe and a needle attached to the base of the syringe. Temperature control was addressed by attaching a heater to the body of the syringe. However, the gel was still solidifying at the base of the syringe and at the needle.  This issue was addressed by attaching high-wattage resistors to the base and the needle. The details concerning the correct temperature control are addressed in a separate blog post. The purpose of this test is to determine the ideal needle diameter and Slic3r settings for the 3-D BioPrinter once the problem of temperature control has been addressed.

Equipment Needed

Equipment

Quantity

3-D BioPrinter

1

Vernier Caliper

1

Agarose Solutions of varying percentages

50 ml

Needles with different gauge diameter

1

Laptop with Slic3r and Pronterface Installed

1

USB Cables

2

Table 1. Equipment needed for accuracy testing

Procedure

For the following test prints, a solid 20mm x 20mm x 5 mm cube was printed

  1. It was decided to start with a 1% agarose solution and a 18 gauge syringe needle[1]. This led to an overflow of the liquid from the syringe as illustrated in Figure 1. Due to this overflow, the liquid did not have enough time to solidify. Therefore, the print was stopped even before the first layer was completely printed. The Slic3r settings shown in Table 2 were used for this test print.  

Untitled-1 

Figure 1 Overflowing liquid


Perimeter

Value

Nozzle diameter (18 gauge needle inner diameter)

0.8mm

Filament Diameter

40 mm

Travel Speed

50 mm/s

First Layer Speed

20 mm/s

Fill Density

1

Fill Pattern

Concentric

Top/Bottom fill pattern

Concentric

Table 2. Slic3r settings used for 1st test print

  1. It was then decided to switch to a needle with a smaller inner diameter: a 20 gauge needle was chosen.  Subsequently, the nozzle diameter and the filament diameter had to be changed in Slic3r. The new Slic3r settings are shown in Table 3. This yielded a much better result as can be seen in Figure 2. The flow was slow enough to facilitate the gelling of the liquid. Even after gelling, the gel structure was not as strong as expected in that it was not able to hold its weight which was a level 1 requirement. Therefore, It was decided to use 2% agarose gel which would be stronger than 1 % agarose gel after gelling. 2% agarose gel has the same gelling temperature as 1 % agarose gel. Therefore, there was no need to adjust the temperature of the syringe.  It was also decided to use 4% starch in the solution to increase the viscosity of the fluid. This slowed down the flow of the liquid through the needle without the need to change temperature. Starch and Agarose are both carbohydrates, therefore adding starch did not alter the viability or biological nature of the solution.

Perimeter

Value

Nozzle diameter (20 gauge needle inner diameter)

0.6 mm

Filament Diameter

29 mm

Travel Speed

50 mm/s

First Layer Speed

20 mm/s

Fill Density

1

Fill Pattern

Concentric

Top/Bottom fill pattern

Concentric

Table 3. Slic3r settings used for 2nd test print (Changes highlighted)

2

Figure 2. Overflowing gel

  1. A test print was then carried out using a 2 % agarose, 4 % starch solution (See Table 4 for exact composition of solution).

The resulting solution had just the right amount of viscosity, which justified the use of starch. The final structure was also strong enough to hold its own weight, which justified increasing the concentration of agarose gel. This structure also had the correct dimensions. But there was one problem; instead of being a solid cube like ‘American Cheese’, the block turned out like ‘Swiss Cheese’ with air bubbles in the middle.

Chemical

Quantity

Water

50 ml

Agarose

1 g

Starch

2 g

Table 4. Chemical Composition of 2% Agarose 4 % Starch Solution

 3a 3b

Figure 3. Test Print using 2% agarose and 4% Starch

  1. During the third test print, it was observed that the travel speed of the extruder increased after printing the first layer. This was problematic since it was not possible to adjust the flow of the liquid for two different travel speeds. Even though the first layer turned out fine, the extruding liquid broke off contact with the structure at certain points in the 2nd layer due to a faster speed. This break in contact in the second layer meant that there was also break in contact in the third and subsequent layers leading to a domino effect. .  We then switched to advance mode in slic3r that gave us a better control of the various speeds of the printer. All these were set to a smaller and equal value of 20 mm/ s. The settings are shown in Table 5. The structure printed using these settings are shown in Figure 4.

Perimeter

Value

Nozzle diameter (20 gauge needle inner diameter)

0.6mm

Filament Diameter

29mm

Travel Speed

20 mm/s

First Layer Speed

20 mm/s

Fill Density

1

Fill Pattern

Concentric

Top/Bottom fill pattern

Concentric

Perimeter Speed

20 mm/s

Small perimeters

20 mm/s

External Perimeters

20 mm/s

Infill

20 mm/s

Solid Infill

20 mm/s

Top solid infill

20 mm/s

Support Material

20 mm/s

Bridges

20 mm/s

Gap Fill

20 mm/s

All Acceleration Controls

0 mm/s2

Table 5. Slic3r settings used for 4th test print  (Changes from previous step highlighted)

4

Figure 4 Final Printed Structure

The actual dimensions of this structure were also very close to the expected dimensions.

5a 5b 5c 

Figure 5. Measurements of Final Printed Structure

Conclusion

A 2% Agarose and 4% starch solution is the ideal solution to be used in the bioprinter. The settings used in Step 4 of this test plan are the ideal settings for the bioprinter when it is being used to print 2% Agarose and 4% Starch solution.

[1] – For needle diameters, check: http://en.wikipedia.org/wiki/Needle_gauge_comparison_chart

A System Overview of 3-D BioPrinter

By Omair Tariq,  Systems and Test Engineer

Untitled-1 

Fig. 1 System Block Diagram of the 3-D BioPrinter

Following is a system engineering perspective of the 3-D BioPrinter

1.)    A 3-D Model is sent as instructions known as G-Code from the Computer to the Primary Arduino (Arduino MEGA) that are then translated by the Arduino, using the RAMPS 1.4 shield’s stepper motor drivers, into movements of the Axes Stepper motors and Extruder Linear Actuator. The instructions are sent via a USB Cable.

2.)    A secondary Arduino (Arduino UNO)  is used to for temperature sensing and control. The thermistors attached to the print bed and the extrusion syringe send measurements back to the Arduino, which then sends the readings back to the computer, via a USB cable, to be seen by the user. The user sets the desired temperatures of the print bed and the extruder on the computer. This set temperature is transferred via the same USB cable to the Arduino. The Arduino then translates this set temperature into Pulse Width Modulation (PWM) for the MOSFET driver and the Solid State Relay that are attached to the Print-Bed Cooler and the Extruder Heater Respectively.

2

Fig 2. Detailed RAMPS 1.4 Block Diagram for 3-D BioPrinter

RAMPS 1.4 Shield

The detailed RAMPS 1.4 Block Diagram shows the sections of the shield that are being used and not being used by us this semester.  Sections being utilized by us this semester:

1.)    Stepper Motor Drivers

4 out of the 5 stepper motor drivers are being used to control the stepper motors and linear actuators. There are two stepper motors to control the Y-Axis, one to control the X-Axis, a linear actuator to control the Z-Axis and another linear actuator to control the Extruder. Since there are two stepper motors on the Y-Axis and only one stepper motor driver, the stepper motor drivers will be connected 180 degree out of phase.

2.)    Endstops

The End Stops are switches mounted on the axes to determine the home position of each of the Axes.

3.)    Reset Button and LED

The Reset Button is used to reset the Arduino whenever the need arises such as when the Arduino stops responding. The LED indicates whether the RAMPs 1.4 is on or not.

We will not be using the following sections of the RAMPS 1.4:

1.)    1 Stepper Motor Driver

2.)    Heaters & Fans

3.)    Sevos

4.)    Aux-1

5.)    Aux – 2

6.)    Aux – 3

7.)    Aux – 4

8.)    I2C

Note: The thermistors portion of the RAMPS 1.4 is not being utilized either since we just attach a resistor to this section to fool the RAMPS shield into thinking that the thermistor is being used. This was done because the code related to the thermistors could not be commented out in the firmware. See the blogpost here for more details.

3 

Fig 3. Softwares Used in 3-D BioPrinter

Softwares needed for 3-D BioPrinter

  • Arduino IDE
    • This is used to upload the MARLIN Firmware to the Primary Arduino of the BioPrinter if any modifications are made.
    • Solidworks
      • This is used to create a 3-D model of the desired object and generate an STL file.
      • Slic3r
        • This is used to convert the STL file of the 3-D model into printing instructions, known as G-Code.
        • Pronterface
          • Pronterface is  a GUI used to interact with the 3-D printer.It is primariliy used to transfer the G-Code, generated using Slic3r , to the Primary Arduino.  It can be also be used to control the movement of the X,Y and Z axis and the Extruder Linear Actuator for other purposes such as calibration.

Gel Point Test Plan Excuted

By Omair Tariq

Purpose

The purpose of this test plan was to carry out the test plan here and determine the gel point of 1% Agarose gel. This test plan would also serve to verify the specification already provided by the manufacturer of the powder.

Equipment needed

Equipment

Quantity

Spatula

1

Mesuring balance accurate to a 100th of a gram

1

900 Watt Hot Plate

1

100 ml beaker

1

50 ml graduated cylinder

1

Mercury-in-glass thermometer  (Range: 0oC-110oC)

1

Agarose gel Type A0169 by Sigma Aldrich

See Table 2

Distilled water

See Table 2

Safety Goggles

1 per person

Latex Gloves

1 per person

Table 1. Equipment needed for Gel Point Testing

The amount of Agarose gel and Distilled water is to be determined by the desired gel concentration. 

Percent Gel Desired (concentration) =100 x  (Amount of Agarose in grams) / (Amount of water in milliliters)

Concentration

Agarose Gel Type A0169  (± 0.05g) Distilled water ( ± 0.1 ml)

1%

0.50 g

50.0 ml

2 %

1 g

50.0 ml

5 %

2.5 g

50.0 ml

And so on…


Table 2.  Amount of agarose gel powder and water required to produce desired gel concentration for 3D bioprinter

For the purpose of the bio-printer the amount of distilled water is to be limited to 50.0 ml since the extruder is a 60 ml syringe. The maximum amount of water is limited to 50 ml rather than 60 ml to avoid spilling of the gel and consequently, the waste of valuable gel mixture.

Test Plan Instructions


Note: This test plan can be carried out to determine the gelling point of any concentration of gel. 1 % gel concentration was chosen for the purpose of our bioprinter.

1.Put a 100 ml beaker on the weighing balance. This was not done due to the limitations of our weighing balance which had a maximum limit of 20 grams. Instead, a small plastic dish was used to weigh the powder.


 Untitled-1

2.Zero the balance so that the weight of the beaker does not hinder measurements.

Untitled-2

Use a clean spatula to put 0.50 grams of Agarose gel Type A0169 powder by Sigma Aldrich into the beaker. 


 Untitled-3

4.Measure out 50 ml of distilled water using a graduating cylinder.


 Untitled-4

5.Pour the 50 ml of distilled water into the beaker containing the 0.50 grams of Agarose powder. 

Untitled-5 

6.Measure the weight of the solution using a measuring balance. It should weigh about 51 grams. This was not done due to our weighing balance having a maximum weight limit of 20 grams.

7.Mix the solution using a Mercury-in-Glass Thermometer or a spatula.


8. Put the beaker containing the mixture from Step 4 onto a hot plate.


 Untitled-6


 9.Bring the solution to a boil and let it boil for 5 minutes.


 Untitled-7

10.At the same time, place the graduating cylinder filled with water on the hot plate.


 Untitled-8


 11.Reweigh the solution after boiling.

12.Add enough hot water from the graduating cylinder, if necessary, to bring the total weight of the solution to 51 grams.

13.Allow the mixture to cool. Mix the solution continuously until the solution reaches a temperature of 50oC. At this point, further mixing might lead to problems in accurately determining the gelling temperature of the solution.   Observe the viscosity of the solution every 10o C until the solution reaches a temperature of 40oC.  Once the solution has reached a temperature of 40oC, or when the solution starts to gel, the viscosity of the solution must be observed every 1oC.

14.The viscosity is to observed using the following steps:
Take a small amount of solution on the spatula,
Raise the spatula about 12 inches above the beaker.
Carefully, drop the solution by tilting the spatula.


This happened when the solution was at a temperature of 36oC. Therefore, it was determined that 1 % agarose gel has a gel point of 36oC. At the gelling point, the solution turned rubbery. When it was attempted to mix the gel at the gel point, the gel broke into smaller pieces. The smaller pieces did not merge after sometime as they would if the gel was still a solution. This would not happen if the mixture were still a solution, thereby proving that the gelling point was reached.


Untitled-9 

Untitled-10


The solution gelled at 36oC


The gel structure breaks into small solid pieces if mixed at a temperature below the gelling temperature


This test plan can be seen carried out here.


Conclusion


Through this test plan, it was determined that 1% agarose gel has a gelling point of 36 oC. This test also verified the values that were provided by the manufacturer of agarose powder.  Therefore, the extruder temperature will be maintained at 38oC to ensure smooth extrusion of the gel. 


Temperature Control at the Tip & Base of the Syringe

By W. Mevan Fernando & Ali Etezadkhah

After pouring the agarose gel into the syringe it was found that the gel solidified at the base of the syringe  and at the tip of the needle due to lack of heating in those specific areas. Initially we decided to use 0.5Ω, 5W wire wound resistors to heat the base of the syringe. After running four of these resistors in series to increase the resistance and limit the amount of current passing through them, it was found that the resistors heated up enormously and would thus melt the plastic in the syringe. Below are current and power calculations we obtained for the four resistors in series. They were run using a 12V power supply.

Req = 0.5+0.5+0.5+0.5 = 2Ω

Pdissipated = I2Req = (62) (2) = 72W

Next, we wound a copper wire around four of the same resistors, also in series, with the resistors stacked on top of each other to test if the copper wire conducted enough heat to heat up the base of the syringe. Thermal tape was wrapped around the resistors and copper wire to stop heat from escaping. Even though the copper wire heated up, it didn’t carry enough heat after 2 inches of wire, preventing us from using this method as a solution to the problem.

Finally we decided to use two 330Ω resistors on the needle of the syringe and six 330Ω resistors on the base of the syringe both connected in parallel to provide heat to prevent the gel from solidifying. Thermal adhesive was used to glue the resistors on to the base and the needle. The 330Ω resistors heated up to around 40°C when we tested them which provide enough heating to solve our problem. The resistors were actually found be 328Ω once we measured them using a digital multi meter. Below are current and power calculations we obtained for the 330Ω resistors.

For the needle:

Req = (330*330)/(330+330) = 165 Ohms

 Pdissipated = I2Req = (0.0732) (165) = 0.873W

For base of Syringe:

 1/Req = 6* (1/330)

Req = 55 Ohms

Pdissipated = I2Req = (0.2182) (55) = 2.618W

Req measured using a digital multi meter for the needle and the base of the syringe came up to be 164 and 54.9 respectively. These values match the theoretical values we calculated above. The current draw from these resistors is quite low as well and thus would not damage our power supply in contrast to the wire wound resistors we used before.

The pictures below show the resistors placed on the needle and base of the syringe:

1 

Two 330 resistors glued to needle using thermal adhesive

2

Connecting wires soldered on to the resistors

3 

Thermal tape used to insulate the needle and keep leads from touching

4

Thermal tape used to insulate the base and keep leads from touching Six 330 resistors glued to base of syringe using thermal adhesive and soldered to connecting wires

5

Six 330 Ohm resistors glued to base of syringe using thermal adhesive and soldered to connecting wires

6

Needle connected to syringe and placed in the extruder

Thermoelectric Peltier Cooler Secondary Testing & Print Bed Installation

By W. Mevan Fernando

Due to the first set of TECs we purchased being faulty, we decided to purchase a single high quality TEC with a current rating of 10A. This would provide enough cooling by itself to cool the print bed.

 02-Mevan

The video below shows the print bed setup. A much larger heat sink was used along with the TEC and a fan was used to cool the heat sink. The TEC and fan were connected to our 12V, 30A power supply. Premium Ceramic Polysynthetic Thermal Compound was used on both sides of the TEC to provide better contact with the heat sink on the bottom and the aluminum print bed on top. The infrared thermometer we used before was faulty as well and hence a regular glass thermometer was used to show that the temperature of the print bed did in fact decrease. The temperature of the print bed was clearly colder than what was read on the thermometer due to the fact that all sides of the thermometer were not in contact with the aluminum. This could be seen by the condensation that was forming on the print bed and also just by touching it. Once again thermal compound was used to provide better contact with the thermometer and print bed.

Video at this link:
https://www.youtube.com/watch?v=aijkuX2GWC0

The pictures below show the installation of the whole print bed setup to our printer. 8-32 threaded rods were cut into 12” and used to attach the print bed to the printer. Two pieces of plastic were attached under the fan to ensure that there was space for airflow at the bottom of the fan.

mev1 

mev2

After screwing the print bed on to the printer, an iPhone app was used to check if the print bed was levelled so that there wouldn’t be any complications while printing.

mev3

Thermoelectric Peltier Cooler Explained & Initial Testing

By W. Mevan Fernando

Peltier cooling modules are solid-state active heat pumps that transfer heat from one side to the other based on the Peltier effect. A TEC has two plates, the cold and the hot plate. Between those plates are several thermocouples. All those thermocouples are connected together and two wires, the negative and the positive, come out. If voltage is applied to those wires, the cold plate will be cold and the hot plate hot. In our design, the hot plate will be connected to a heat sink so that the heat gets pumped out. If not, the device will not work properly and may break down. In our design, we will use the peltier cooler to create a cool bed made of aluminum to cool down the agarose gel we use as our printing material so that it will cool down faster and maintain its shape as layers are added to the 3D structure. A schematic of a TEC connected to a heat sink is shown below.

 mav


In our design we will use 4 TECs to provide enough cooling for our print bed. The TECs we purchased had a current rating of 6A. We ran the TECs through our 12V, 30A power supply which we use for our printer. The video below shows the tests we ran to see the behavior of the TECs. One of them was connected to a heat sink to observe the difference in temperature readings with and without the heat sink. As expected the temperature of the one connected to the heat sink decreased while the temperature of the rest increased.

Video at this link:
https://www.youtube.com/watch?v=YwmJ70BcB7k

The following picture shows the setup we used to connect the TECs to the aluminum print bed. The placement of the TECs was decided upon the fact that the printing will be done only towards the center of the print bed. Thermal adhesive was used to glue the TECs to the bed.

 01-Mevan

After connecting the TECs to the print bed, they revealed to be faulty. This maybe because we didn’t use a fan to cool down the heat sink once all of them were connected together or because of the poor quality of the TECs we purchased.

References

Picture of schematic:  http://www.tetech.com/FAQ-Technical-Information.html


Resolution And Software Summary

By: Anh Nguyen

I/ X,Y,Z Resolution

The object of this experiment is to calculate the resolution of the x, y and z axis of the 3D bio printer. First, the theoretical values from the manufacture’s specification sheet are used for the resolution calculation. Then the experimental values are used to calculate resolution. We will use both online RepRap calculator and the formula for the resolution calculation.

1/ Z axis:

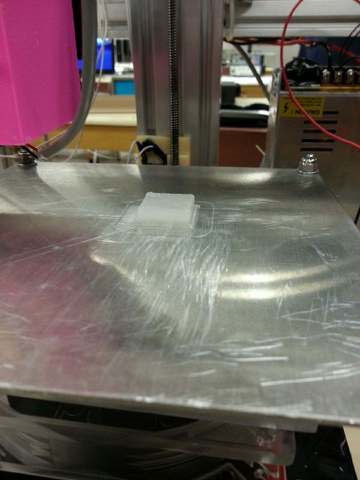
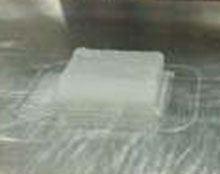
The threaded rod is used for the z axis

The following parameters are used for the z axis:

– Motor Step Angle: 1.8 degree/step and 360 degree/rev

            step/rev =  = 200 steps/rev

– Driver Micro Stepping: 1/16 u step (we use the 1/16 Pololu motor driver)

– Presets: 1/4” 1/16” ACME

a. From the specification sheet, the lead screw pitch is 1.5875 mm/rev

+ Using RepRap calculator, the resolution is 2015.75 step/mm


+ Using the mathematical formula:

Leadscrew ( *  * Motor ( =

(( *  * 200 ( = 2015.75 step/mm

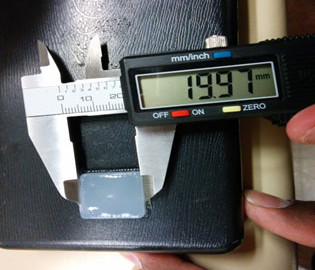
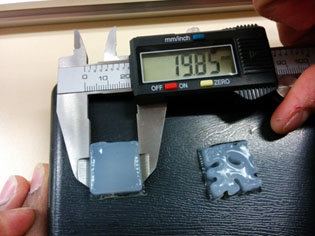
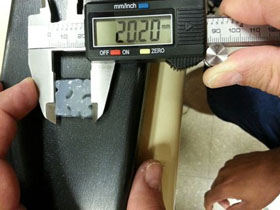
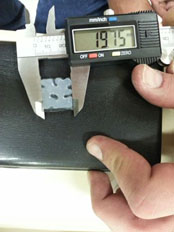
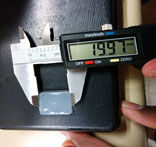
b. To get the experimental lead screw pitch value, we will need to measure the length of the rod and the number of lead screw within that length. Since we do not want to take the printer apart, we choose a part of the rod to measure the length and count the lead screw. The length of this section of the rod is 75.2 mm and the number of lead screw is 50.

Distance between each lead screw:

             = 1.504 mm/rev

+ Using the RepRap calculator, the resolution is 2127.66 step/mm


+ Using the formula, the resolution is 2127.659 step/mm

Percent error between the theoretical and experimental resolution:

             *100% = 5.55%

This percentage error is relatively large. This can be a result from human error in calculate the number of lead screw and also the uncertainty from the equipment (caliper).

We decide to use the theoretical value for the software to calibrate the z axis. We will later re-calculate the resolution of the z axis from the calibration’s result.

2/ X and Y axis:

The belt and pulley are used for the x and y axis

The following parameters are used for the x and y axis resolution calculation:

– Motor Step Angle: 1.8 degree/step and 360 degree/rev

            step/rev =  = 200 steps/rev

– Driver Micro Stepping: 1/16 u step (we use the 1/16 Pololu motor driver)

– Belt presets: 2mm pitch

a. From the specification sheet, the belt pitch is 2mm and the pulley tooth is 30

+ Using RepRap calculator, the resolution is 53.33 step/mm


+ Using mathematical formula:

(motor_steps_per_rev *  ) / (belt_pitch * pulley_number_of_teeth)

(200 step/rev * ) / (2mm * 30) = 53.33 step/mm

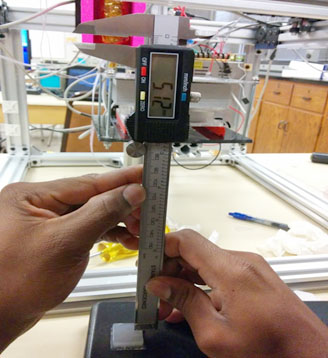
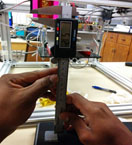
b. The measured belt pitch using a caliper is 2mm. The number of pulley tooth counted is 29

+ Using the RepRap calculator, the resolution is 55.17 step/mm


+ Using the mathematical formula, the resolution is 55.17 step/mm

Percentage error between theoretical and experimental values:

             * 100% = 0.289%

The percentage error is small. We will use the theoretical value for the software to calibrate the x and y axis. We will later re-calculate the x and y resolution from the calibration’s result.
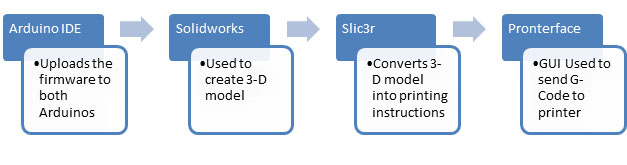
2/ Sofwares:

To control the 3D bio printer, we will use the three following softwares: NETFABB, Slic3r and Pronterface.

NETFABB is a free cloud, which allows us to clean the .STL file so it is ready to be sliced into G-code (machine code which represent the created model).

Slic3r is software that converts the .STL file into G-code. The software can be downloaded online from: http://slic3r.org/. There are 4 tabs in the Slic3r software: Platter, Print Settings, Filament Settings and Printer Setting. We will add the G-code in the Plater tab and set the settings for each requirement.


In the start of the G-code, the printer is told to home all axis and start printing. At the end, only the x-axis is home and all the motors are turned off.

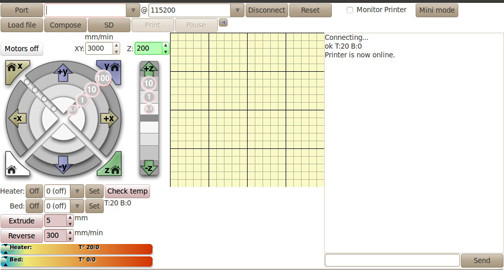
Pronterface: After the G-code is ready, it will be loaded to the Pronterface software.


The baud rate of the Pronterface is set to be 25000, the same as the baud rate of the Marlin Firmware.

The Marlin Firmware is used for the Arduino to set up the movement for the 3D bio printer. The firmware can be downloaded from: https://github.com/ErikZalm/Marlin

In the code, the speed of communication is set to be 25000.

            // This determines the communication speed of the printer

            #define BAUDRATE 250000

            // #define BAUDRATE 115200

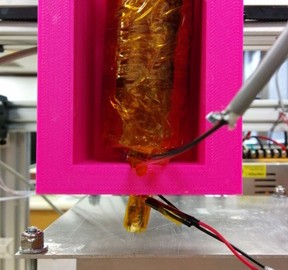
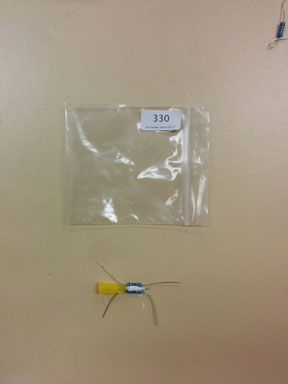
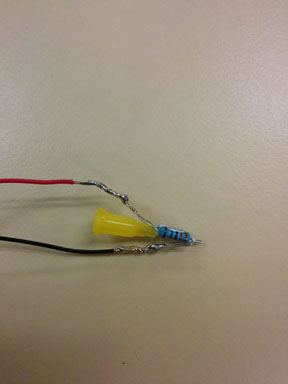
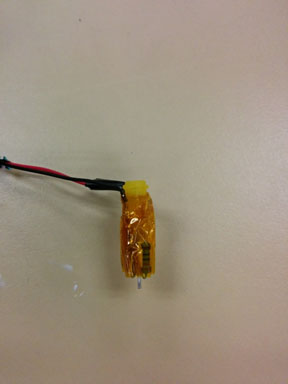
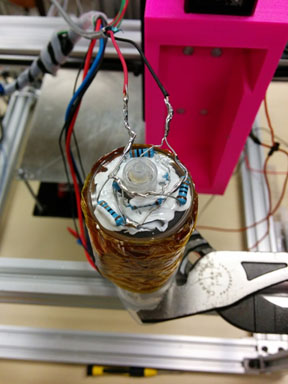
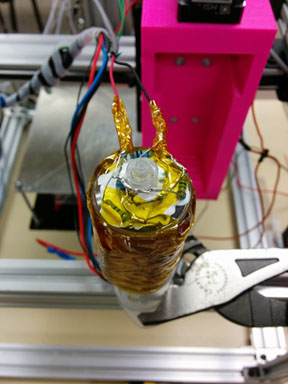
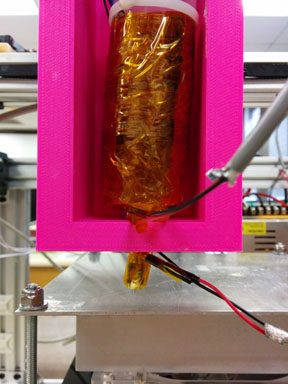
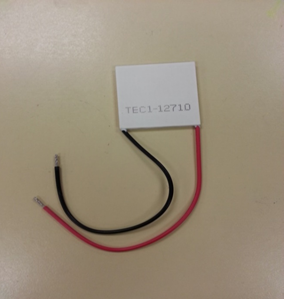
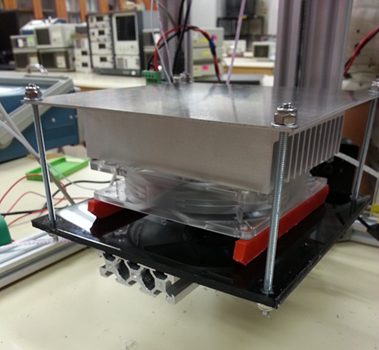
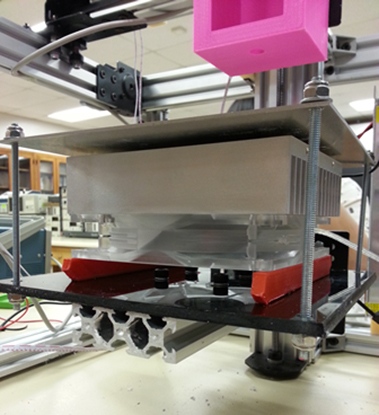
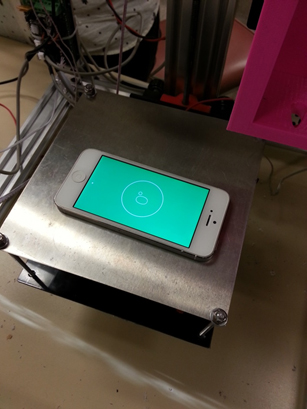
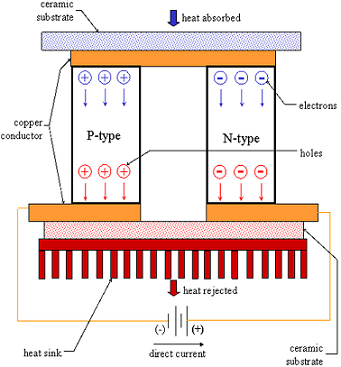
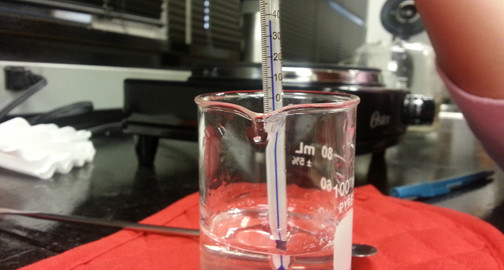
We will take out the thermal settings in the code because we will use a Peltier cooler attaching to the bed to cool down the printed gel and a second Arduino to control the temperature of the gel inside the syringe. However, when we comment out the thermal setting of the code, an error is returned in complying because the firmware wants to run the subroutines that control the thermal settings of the bed and the extruder. To solve this problem, we connect 100kohm resistor instead of the thermistor and keep the original code.

            // 0 is not used

            // 1 is 100k thermistor – best choice for EPCOS 100k (4.7k pullup)

            // 2 is 200k thermistor – ATC Semitec 204GT-2 (4.7k pullup)
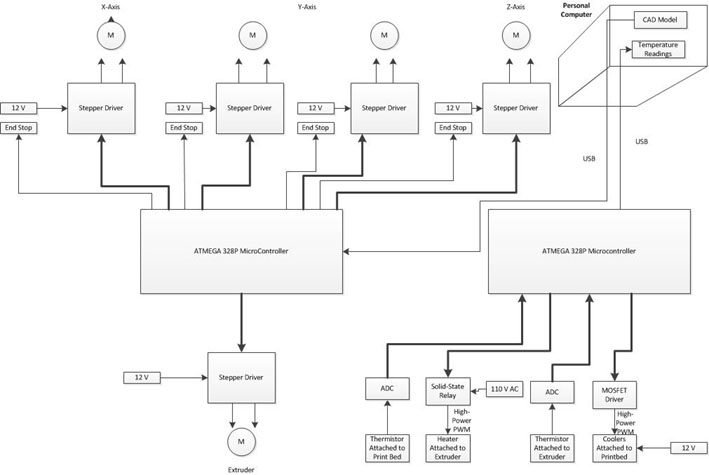
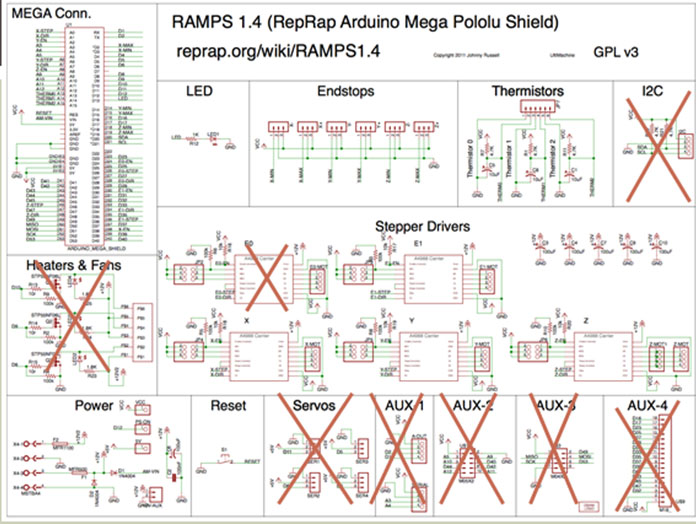
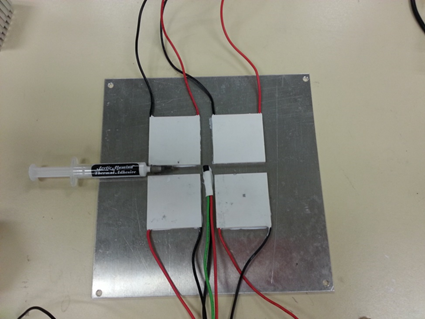
3/ Wiring:


We use a new linear actuator for the extruder. It has 2 pairs of wire: red/ red white and green/ green white for two phases.


First, we will test the polarity of the connecting wire from the ramp to the actuator. The ramp side has 4 wires: black, brown, red and orange. The actuator side has blue, yellow, green and read wires.

                        Ramp                           Actuator

1A                   Red                             Green

1B                   Black                           Blue

2A                   Brown                         Yellow

2B                   Orange                                    Red

Red / Red White will go to 1A and 1B while Green / GreenWhite will go to 2A and 2B or vice versa. We need both two phases of the actuator for precise movement. The current goes through the actuator should be from 1.75 to 1.2A. Since the actuator does not have any motor in it, its motion depends on the control of the ramps on the Arduino board. We need to check the connection of the ICs on the Arduino board to make sure there is enough current going through the actuator.


Gel Point Test Plan

By Omair Tariq

Scope

It was determined that agarose gel will be used as the “ink” for the 3-D bioprinter. Agarose gel was chosen primarily because of its low cost and its use as an overlay for cells in tissue culturing. [1]. The gel point is the temperature at which the gel mixture transitions from a liquid to a gel. The melting point is the temperature at which the mixture melts from a gel into a liquid. Agarose gel is special in that it has a different melting point and gelling point.  The purpose of this test is to determine the gel point of agarose gel Type A0169 by Sigma Aldrich. 

Equipment needed

Equipment

Quantity

Spatula

1

Measuring balance accurate to a 100th of a gram

1

900 Watt Hot Plate

1

100 ml beaker

1

50 ml graduated cylinder

1

Glass thermometer  (Range: 0oC-110oC)

1

Agarose gel Type A0169 by Sigma Aldrich

See Table 2

Distilled water

See Table 2

Safety Goggles

1 per person

Latex Gloves

1 per person

Table 1. Equipment needed for Gel Point Testing

The amount of Agarose gel and Distilled water is to be determined by the desired gel concentration.

Concentration Agarose Gel Type A0169  (± 0.05g) Distilled water ( ± 0.1 ml)
1% 0.50 g 50.0 ml
2 % 1 g 50.0 ml
5 % 2.5 g 50.0 ml
And so on…    
And so on…    

Table 2.  Amount of agarose gel powder and water required to produce desired gel concentration for 3D bioprinter

For the purpose of the bio-printer the amount of distilled water is to be limited to 50.0 ml since the extruder is a 60 ml syringe. The maximum amount of water is limited to 50 ml rather than 60 ml to avoid spilling of the gel and consequently, the waste of valuable gel mixture.

Test Plan Instructions

Note: This test plan can be carried out to determine the gelling point of any concentration of gel. 1 % gel concentration was chosen randomly for this test plan.

  1. Put a 100 ml beaker on the weighing balance.
  2. Zero the balance so that the weight of the beaker does not hinder measurements.
  3. Use a clean spatula to put 0.50 grams of Agarose gel Type A0169 powder by Sigma Aldrich into the beaker.  
  4. Measure out 50 ml of distilled water using a graduating cylinder.
  5. Pour the 50 ml of distilled water into the beaker containing the 0.50 grams of Agarose powder.  
  6. Measure the weight of the solution using a measuring balance. It should weigh about 51 grams.
  7. Mix the solution using a Mercury-in-Glass Thermometer or a spatula.
  8. Put the beaker containing the mixture from Step 4 onto a hot plate.
  9. Bring the solution to a boil and let it boil for 5 minutes.
  10. At the same time, place the graduating cylinder filled with water on the hot plate.
  11. Reweigh the solution after boiling.
  12. Add enough hot water from the graduating cylinder, if necessary, to bring the total weight of the solution to 51 grams.  
  13. Allow the mixture to cool. Mix the solution continuously until the solution reaches a temperature of 50oC. At this point, further mixing might lead to problems in accurately determining the gelling temperature of the solution.   Observe the viscosity of the solution every 10o C until the solution reaches a temperature of 40oC.  Once the solution has reached a temperature of 40oC, or when the solution starts to gel, the viscosity of the solution must be observed every 1oC.
  14. The viscosity is to observed using the following steps:
    1. Take a small amount of solution on the spatula,
    2. Raise the spatula about 12 inches above the beaker.
    3. Carefully, drop the solution by tilting the spatula.
    4. At the gelling point, the solution will have turned rubbery. If it is attempted to mix the gel at the gelling temperature, it will be observed that the gel will break into smaller pieces. The smaller pieces will not merge after sometime as they would if the gel was still a solution. This would not happen if the mixture were still a solution, thereby proving that the gelling point was reached.

Conclusion

By determining the Gel point, we will be able to determine the temperature that should be maintained in the extruder head. The extruder head should be kept at a temperature of 1-2 oC above the Gel point. If the extruder head is maintained at a temperature equal to or lower than the gelling temperature, extrusion cannot be performed accurately since the gel will only extrude as large chunks rather than flowing smoothly from the extruder head. Therefore, maintaining the temperature of the extruder head 1-2oC above the gelling point will enable smooth extrusion of the gel. The plate must be at a temperature lower than the gelling temperature so that the gel is able to hold its shape after extrusion.