E-racer/Spring/2019
Magnetic Force
Author: Jeremy Anderson
Table of Contents
Introduction
In order to find out how heavy the robot could be while still staying on the board, it was necessary to find out how much force a magnetic solution could be expected to generate. Once this force was known, the frictional force equation could be used in conjunction with the experimental value for the coefficient of friction to extrapolate how much mass the robot could consist of before the magnets fail to provide enough force to keep the robot on the board.
Theory
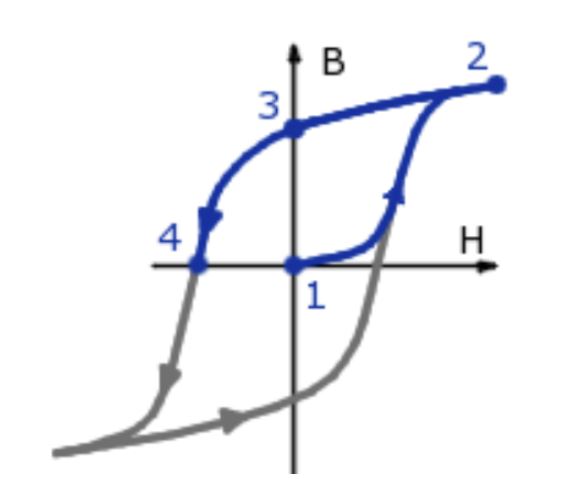
The pull force of a magnet is proportional to its maximum energy product which is defined to be the flux density (B) multiplied by the field strength (H). In the CGS system, flux density is measured in Gauss, and field strength is measured in Oersteds. In the SI system, flux density is measured in Teslas, and field strength is measured in Amps per meter. The flux density (B) can be thought of as a material’s response when an outside field (H) is applied. When a material is magnetized, a magnetic field is applied to it with an electromagnet or a permanent magnet. As the material is exposed to an increasingly large external field, the magnet becomes saturated and its flux density approaches a maximum value asymptotically. When the applied field is removed, the flux density of the magnet reduces to its residual flux density, not its original value of zero. This non-linear response is called hysteresis. If a new field is applied to the magnet in the opposite direction of the original with increasing magnitude, the flux density of the magnet will eventually reach zero. The strength of the field that needs to be applied to negate the field of the magnet is called the coercivity of the magnet and describes its resistance to demagnetization. After the magnitude of the applied field exceeds the coercive field strength, the magnet’s field follows the same B versus H curve as the original magnetization process, but rotated 180° about the origin. The whole path that the magnet’s flux density and field strength follow throughout this process is called the BH curve or a hysteresis loop. Each material has its own unique BH curve which must be measured experimentally. An example of a BH curve can be seen below in Figure 1.
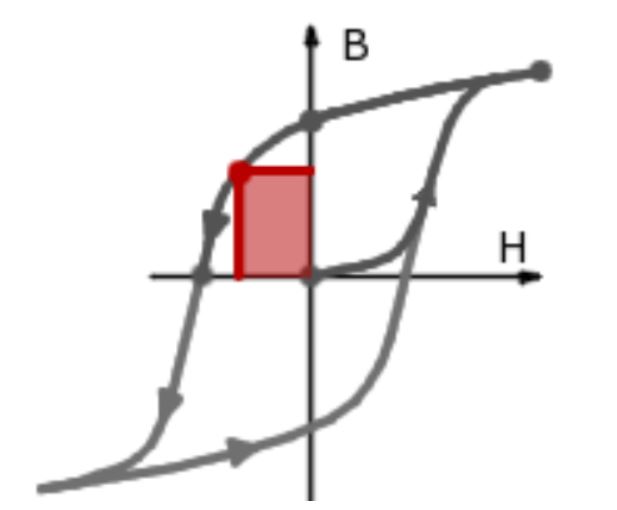
Point 1 to point 2 shows the path of magnetization as the material is saturated by the applied field. Point 2 to point 3 shows what happens when the applied field is removed and the flux density drops to the residual flux density of the material. Points 3 to 4 show the relation between the fields when an oppositely oriented field is applied to the magnet. The curve crosses the H axis when the applied field is equal to the coercivity of the material. The behavior of the magnet is described by its curve in quadrant 2, because this quadrant describes how the material responds to applied magnetic fields after it has been magnetized. Accordingly, the maximum energy product of a magnet is defined to be the place in the 2nd quadrant where the product of B and H is maximized. This value is shown graphically in Figure 2.
The pull force of a material is directly proportional to its maximum energy product, so using a magnet with double the maximum energy product will double the pull force. The ratings used for high performance magnets are typically in Mega Gauss Oersteds. Grade N35 neodymium magnets have a maximum energy product of 35 MGOe, meaning that they provide approximately 10 times the pull force of a typical ceramic magnet of the same size and shape because a ceramic magnet has an energy product of 3.4 MGOe. A table of energy products is shown below in Table 1.
| Magnet Type | Max Energy Product (MGOe) |
| Neodymium | 35-52 |
| SmCo 26 | 26 |
| Alnico 5/8 | 5.4 |
| Ceramic | 3.4 |
| Flexible | 0.6-1.2 |
Table 1. The max energy products of 5 magnet materials
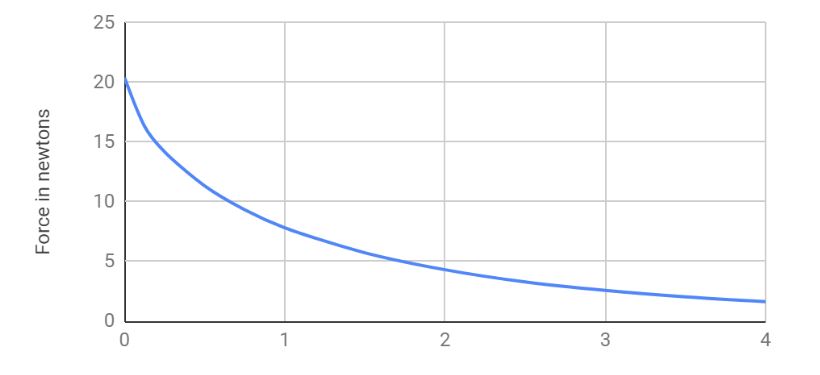
K&J Magnetics provide a pull force calculator on their website which claims that the grade N35 magnets used in E-racer’s design should provide a pull force of 20.4 newtons of force at a distance of 0 mm from the board and a pull force of 2.58 newtons at a distance of 3 mm. The whole force curve can be seen in Figure 3 below.
Because the coefficient of friction was determined in the experiments described in the last blog post, if a number of magnets and a distance from the board are chosen, the resultant force can be used in conjunction with the frictional force equation to solve for a maximum mass of the robot that the friction of the treads will support. In the case of the E-racer, the original plan was to use 6 magnets at 2.5 mm. This would result in a total theoretical force of 19.75 newtons. Plugging into the frictional force formula gives Equation 1.

Equation 1. Plugging the theoretical magnetic force and coefficient of friction into the frictional force equation
Converting from newtons to kilograms gives Equation 2:
This meant that the theoretical maximum mass that the robot could be was 1.1 kg, which should have been more than enough.
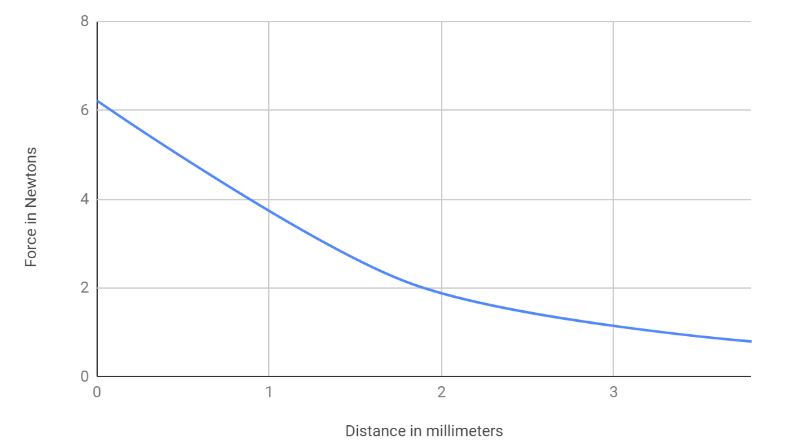
In order to verify that the theoretical force is accurate, an experiment was devised. A spring scale was attached to one of the neodymium magnets with tape and the magnet was placed on a whiteboard. The magnet was pulled off of the whiteboard and the force required to remove the magnet was recorded. This process was repeated with multiple sheets of paper between the magnet and the board. The total thickness of the sheets was measured with calipers each time and an experimental force curve was recorded by plotting the force at each distance. This graph can be seen in Figure 4.
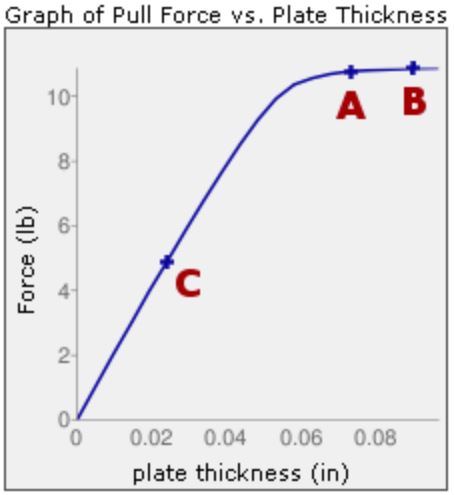
The force that the magnets created in the experiment was significantly less than the theoretical value. This was probably due to the thickness of the steel in the whiteboard. The theoretical pull force value was generated under the assumption that the steel was significantly thick and would not be saturated, meaning that it was not a limiting factor when determining the magnetic attraction with the magnet. According to K&J Magnetics’ article, the magnetic force that a magnet makes scales linearly with the steel plate’s thickness up to a point where the plate is no longer saturated. At this point, increasing the thickness of the plate no longer has an appreciable effect on the pull force. Figure 5 shows the magnetic force of a magnet as a function of the thickness of a steel plate to which it is attached. The graph shows how the force is linear in one region and becomes almost constant after a threshold thickness is surpassed.
K&J suggests that for the plate not to have a significant effect on the force, the plate thickness should be two to three times the largest dimension of the magnet. The largest dimension of the magnets implemented in E-racer was the 12 mm diameter. This means that if the steel used in the whiteboard is less than 36 mm, the thickness of the steel will be a limiting factor, and the pull force will be less than the the theoretical value. After the actual magnetic pull force was known, the true maximum weight of the robot could be extrapolated. Plugging the experimental pull force and the coefficient of friction into the frictional force equation as well as converting to mass from force gives Equation 3:
which means that the actual maximum mass of the robot can be with grade N35 neodymium magnets mounted at 2.5 mm from a CSULB whiteboard in contact with Tamiya brand treads will hold a mass of 505 grams before sliding.
Conclusion
This post outlines the importance of choosing the right magnet type for the given application and how to solve for the frictional force given the coefficient of friction and the normal force.

