Spring 2016 Pathfinder Design and Manufacturing – Rocker Bogie Suspension System Design

Simplified double size rocker bogie

By: Lindsay Levanas (Design and Manufacturing)

Table of Contents

Introduction

The goal of Spring 2016’s Pathfinder is to harbor a Google Tango tablet, phone, solar panels, pan and tilt system and self-contained electronics.1 To support this a rocker bogie suspension system2 will be used. As a purchasable rocker bogie suspension system could not be found to fit the size requirements of the tilt system design3 the suspension system will be built from scratch. This report shall document the design process.


Rocker Bogie Suspension System Design

To start with, a general design for the rocker bogie suspension system (hereafter referred to as suspension system) needed to be selected. To guarantee that basic proportions were kept, ServoCity’s Bogie Runt Rover4 was used as a model. To fit the requirements mentioned in the introduction, this model will be simplified and doubled in size.

Rocker Bogie Suspension System Measurement Process

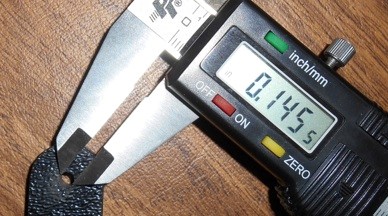
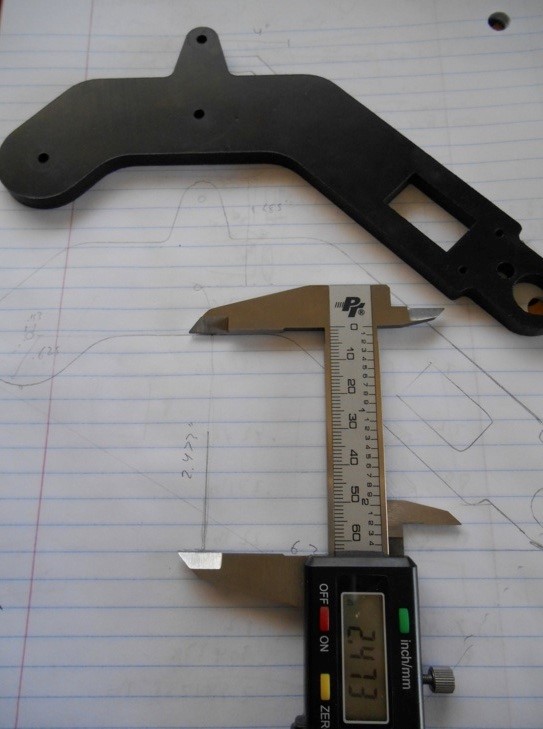
ServoCity’s Bogie Runt Rover consists of six part types that require Solidworks modeling for Spring 2016’s Pathfinder design. To obtain accurate dimensions the individual parts were measured with digital calipers.

f1

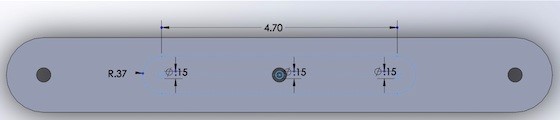
Placement and dimension of screw holes were also measured.


f2 f3

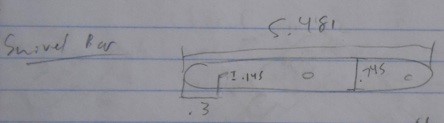
These measurements were then marked on rough sketches to allow for easy reference for the Solidworks model.

f4

Where necessary, simple calculations were done to translate the digital caliper’s measurements into dimensions Solidworks requires.

f5 f6

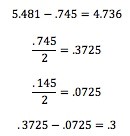
For parts that were difficult for the digital calipers to measure, trace marks were made on paper and measurements were taken from there.

f7


Rocker Bogie Suspension System Model Alterations – Size

After measuring and modeling all of the parts required for the suspension system design, a thickness needed to be selected. To start with, .25in was used, as this was the thickness in the original Runt Rover design. From there, the Solidworks model was doubled in size. The thickness however, was kept at .25in.

f8


Material Selection

Now that the suspension system parts are completely modeled, a material needed to be selected for their fabrication. ABS plastic and aluminum were considered. While ABS plastic has a density of .0376 lb/in^3, compared to aluminum’s density of .0983 lb/in^3,5,6,7 the 3D printers available to Spring 2016’s Pathfinder at this time are not large enough to print the suspension system’s enlarged parts. Therefore, the suspension system will be made out of aluminum.


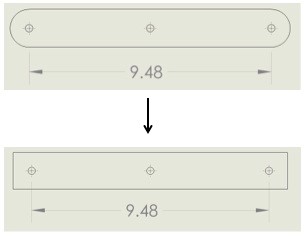
Rocker Bogie Suspension System Model Alterations – Simplification

To assist in the fabrication process, the suspension system parts will be simplified. As the aluminum fabricator currently available to Spring 2016’s Pathfinder is limited to drilling holes and cutting straight edges, the parts will be squared off where necessary. Their crucial measurements however, will be kept the same.

f9


Rocker Bogie Suspension System Weight and Strength Check

Having modeled all of the parts, the next step was to check the weight and strength of the system as a whole. By setting the material of the parts in Solidworks, the weight of a part can be obtained. Alloy 6061 was used, as it is both a commonly used type of aluminum, and can be welded.

f10

f11

Above specified the weight of the swivel bar (the part illustrated in the previous section).  Following this procedure for all of the parts, the total weight of the suspension system totaled 10.65lbs for .25in thick aluminum, and 5.34lbs for .125in thick aluminum.

Keeping the weight in mind, the strength of the legs and top plate were then calculated. Stress and bending distances were solved for and listed in the below two charts respectively.8

f12 f13

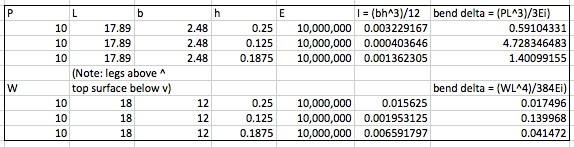
Note that the length used for the legs (17.89) was found by calculating the diagonal of the 10.84in by 14.23in rectangle illustrated below.

f14

While all three thicknesses considered passed the stress test (it takes 6061 alloy aluminum 40,000psi to misshape beyond repair9) the amount each thickness would bend in the legs ranged from .6 to 4.7 inches. To compromise between the weight, stress, and bending tolerance, a thickness of .1875 was selected for the final design.


Conclusion and Future Plans

In conclusion, Spring 2016’s Pathfinder will consist of a rocker bogie suspension system where all parts are simplistically modeled after ServoCity’s Bogie Runt Rover and their measurements follow the procedure documented above. The material used will be alloy 6061 aluminum of thickness .1875in. The complete suspension system is illustrated and dimensioned below and in the future will hold a pan and tilt system, electronics enclosure box, and solar panels on it’s top surface.

f15 f16 f17


Source Material

  1. Spring 2016 Pathfinder Preliminary Design Documentation, Level 1 Requirement, 2/19/16 http://arxterra.com/spring-2016-pathfinder-preliminary-design-documentation/
  2. Rocker Bogie, Design, 2/29/2016 https://en.wikipedia.org/wiki/Rocker-bogie
  3. Spring 2016 Pathfinder Design and Manufacturing – Tilt System Design, Tilt Base, 3/9/16 http://arxterra.com/pathfinder-design-and-manufacturing-tilt-system-design/
  4. Bogie Runt Rover https://www.servocity.com/html/bogie_runt_rovertm__637162_.html#.VvmvlJGprwI
  5. Metals and Alloys – Densities http://www.engineeringtoolbox.com/metal-alloys-densities-d_50.html
  6. ABS Material Datasheet http://teststandard.com/data_sheets/ABS_Data_sheet.pdf
  7. kg/m^3 to lb/in^3 https://www.google.com/search?client=safari&rls=en&q=kg/m%5E3+to+lb/in%5E3&ie=UTF-8&oe=UTF-8
  8. Bending Stresses for Simple Shapes http://atcpublications.com/Sample_pages_from_FDG.pdf

ASM Material Data Sheet http://asm.matweb.com/search/SpecificMaterial.asp?bassnum=MA6061t6

Spring 2016 Velociraptor: Walking Code #1

By Ashlee Chang (E&C)

Table of Contents

Fulfilling Requirements

Level 1 requirements #4 is stated as follows:

The Velociraptor shall be able to statically walk on all surfaces of the course.

The Arduino software, which uses much of C++ programming language, will be used to construct and upload the code onto the Arduino microcontroller.

Coding Summary

This blog will focus on the main walking code for the velociraptor. In the future, a collection of codes must be integrated into the final code in order to meet all the level one requirements. Below is a complete list of the main walking code and all future codes with a short description:

  1. Main walking code: This is for static walking (i.e. upon telling the velociraptor to stop, the velociraptor will be able to balance in its current state).
  2. Walking fast: The main walking code will be modified to have shorter delay times. In addition, the head and tail will not swing in full motion, as the velociraptors momentum will be used for balance.
  3. Sensing – objects: Upon close object detection using the ultrasonic sensor, the velociraptor will halt.
  4. Turning: The user will be able to tell the velociraptor to turn, whether it be because the velociraptor halted in front of an object or at any given time.
  5. Sensing – incline: Upon sensing an incline using an accelerometer, the velociraptor will adapt with a new walking code with its body closer to the floor and smaller steps for balance.

Calibration

callibration

Respective servo degrees of freedom

Servos are limited to movement from 0* to 180*, unable to make a full rotation. Thus, the servos had to be calibrated in order to move in the desired directions. In order to calibrate the servos, they were first connected to the Arduino microcontroller and written to 90*. This way, it is certain that any movements 45* in either direction from this initial calibration will be possible. After calibration, the velociraptor legs were fastened on.

Flaws of the MicroBiPed

Below are visualizations of the Japanese velociraptor Titrus III (our team’s goal), the MicroBiPed of last semester, and the preliminary walking code for the velociraptor.

ezgif.com-video-to-gif (1)

Titrus III walking (https://www.youtube.com/watch?v=GxVv4WNlXMA)

ezgif.com-video-to-gif (2)

MicroBiPed walking (https://www.youtube.com/watch?v=3sMzl35wO98)

ezgif.com-video-to-gif

Velociraptor walking (preliminary code)

Observe the Titrus III. As the back leg is taking a step, the front leg is stationary. However, even though the front leg is stationary, the servos are still moving! As noted in the MicroBiPed and the preliminary velociraptor walking code above, the non-walking-leg servos are not moving. What does this in turn cause? As one foot is taking a step forward, the other foot gets dragged behind, hindering the robot from effectively moving forward. This is the biggest flaw of the MicroBiPed in terms of coding. The purpose of the moving servos of the stationary leg is to propel the velociraptor’s body forward, as opposed to a stationary leg without moving servos dragging the velociraptor behind. Although this causes great complexity in the coding for walking as all four servos are moving simultaneously (and seeing that codes are read line by line), implementing this improvement will no doubt result in an actual walking velociraptor.

Approach

approach

Process for coding the walking

Above shows a block diagram used in the process of compiling the walking code. The velociraptor servos are initialized at [110* 70* 70* 110*] for [front-left back-left front-right back-right]. It is equally important to keep the velociraptor tall enough as to take larger steps and short enough as to ensure the velociraptor keeps balance. From this initial position, a succession of degrees were written for the velociraptor to take a step. The front servo ensures the foot will rise in the air, and the back servo ensures the foot will push out for a large step. After a simple stepping code, a code had to be made for moving the servos of the other leg while the first leg was taking its step. With such complex math due to the different leg sizes and multiple moving pieces, this part was carried out by trial and error. The front and back servos had to complement each other as to keep the foot completely parallel to the floor. Implementing both the step and the perpendicular leg movement in one leg was quite simple, but integrating this motion in both legs at the same time proved to be quite difficult. Thus, a timing diagram was made. Observing that the Titrus III takes about 3.2 seconds for one full walking loop, the velociraptor’s walking loop was set to be close at 3.6 seconds. Initially, the walking code loop conditions were based on a certain servo’s angle. However, as the looping became more complex with multiple servos moving at once, the looping condition variable was changed to one that kept track of time (i.e. the delays), thus utilizing the timing diagram. Lastly, each servo within a loop had to move at a different pace, whether it be double, triple, or even 1.5 times the rate of another servo in its loop. Thus, loops had to be nested within each other, or some servos had to increase or decrease by more than just +1 or -1 degree at a time, in order to achieve the desired degree changes per section of time.

Timing Diagram

timing

Timing diagram

Because all four leg servos will be moving simultaneously, a timing diagram was made as to allow a timing variable be the looping condition in the velociraptor code. A full looping cycle was set to be 3600 ms, broken into 9 segments of 400 ms (meaning there are 9 total main loops in the walking code). The diagram lists the total time elapsed for a full walking loop (which is used as the timing variable in the code), delay in between each segment of code, the degrees of each servo at a certain time, and the change in degrees of each servo over the period of 400 ms. The yellow and blue font colored numbers indicate when that leg is taking a step (when the foot is on the floor, when the foot is in the air, and when the foot is on the floor again). Note there is 400*3=1200 ms in between the stepping of one foot and the other, which will be saved later for the movement of the head and tail responsible for relocating the center of mass on the stationary foot.

Debugging

Although the servos have the capability to rotate from 0* to 180*, the velociraptor leg joints are connected in such a way that limits the servos degree of freedom even more-so. Any slight error in the coding that moves the servo to an angle that the leg joints aren’t meant to handle can cause damage to the servo gears, or if the torque is powerful enough, could potentially snap the legs of the velociraptor. That is why debugging the program on the Arduino without physically connecting power to the servos is important. Serial.print( ) was frequently used to test the program and ensure all variables were as expected.

debugging

Debugging the program and checking the serial monitor

Code Structure

The first section of the code includes the servo library and creates (currently) four servo objects to control each servo. The second section of the code (void setup) initializes variables, attaches the servos to the Arduino pins, writes the initialized angles tot he servo, and includes a Serial.begin(57600) for debugging purposes. Also, the first segment of the walking code is placed here. This is because the velociraptor will initially be in a stance where it is balanced on two feet with the head and tail both facing forward. It is coded so the right foot will take a step first while the front-left and back-left servos are kept at 110* and 70*. Finally when the front-right and back-right servos reach 85* and 140* (at total time = 0), the loop will begin. In the third section of the code (void loop), the left foot will take a step while the right foot re-initializes while keeping perpendicular to the floor. Then, the right foot will take a step while the left foot re-initializes while keeping perpendicular to the floor. This segment of the code repeats.

Walking Code NotePad File

Results

Compare the preliminary walking code versus the improved walking code (see first GIF of the velociraptor). The first prototype has some joint dimensions that are slightly off, and some imperfections on connections and drill hole sizes, thus the velociraptor appears to walk lopsided. Rest assured, the angle movements on each leg mirror each other exactly in the code, which will reflect on the next prototype and/or final product. The prototype must be held as the walking takes place, as there is a head and tail installed for balance. Examine how the stationary foot’s moving servos push the velociraptor forward.

ezgif.com-video-to-gif

Improved walking algorithm

Spring 2016 Velociraptor: Microcontrollers

By: Camilla Nelly Jensen (System Engineer)
 unspecified copyTable 1: Comparing the Microcontrollers
Table 1 compares two possible microcontrollers which acts as the brain for the Velociraptor. The microcontrollers will be used to connect all the components required for the Velociraptor. The chart compares pins available, input voltage, dimension, weight, memory, and average price.
The amount of pins necessary for the Velociraptor has been estimated from the systems resource worksheet which allocates the pins of the components such as sensors, servos, and the Bluetooth module.
The Velociraptor contain a ultrasonic proximity sensor that will be connected to 2 PMW pins, an accelerometer that need 3 analog pins, and 10 digital pins, 8 pins for the 8 servos and 2  pins for the Bluetooth module. The input voltage is the key to understanding the amount of voltage that the batteries must supply. The dimensions and weight are important to create a lighter and smaller body for the Velociraptor.
Minimizing the cost of the microcontroller is important as sought out in the cost report. After comparing the microcontrollers, the group decided on using the Arduino Micro because it has the lowest weight and cost and smallest dimensions and thus is the more cost effective choice for the Velociraptor.

Spring 2016 Pathfinder CSULB Wi-Fi Mapping

lower

By Xiong Lee            (Mission, Systems, and Tests)

Table of Contents

Introduction:

For us to finish our objective, we will need to be able to access the Wi-Fi from CSULB campus. One of our requirements is to have the pathfinder explore the campus and since we need Wi-Fi, we will have to map out the best Wi-Fi signal we have here at CSULB. Using the Wi-Fi Maximiser app, we were able to map out the Wi-Fi at CSULB.

Steps:

  1. First, we need to download the Wi-Fi Maximiser app on your phone here.
  2. Next, we need to be connected to the network that we want to map out. (for us, it is the beachnet +)
  3. After that, we need to have a map of CSULB because we are mapping out the campus here.
  4. Once we import the picture to the app, we can walk around campus clicking on the map every time we want to see the Wi-Fi signal we receive. (Note: we can only click on the map 20 times, then we’ll need to do another map)
  5. After we finish mapping out the Wi-Fi, we can generate the map with details and send to our email.

Results:

These are the results we got from walking around CSULB. We first did the lower campus and then the upper campus.

Lower Campus

lower

If you look at the dots on the map, it is labeled by a letter at the upper right of the dot going in alphabetical order from A to T (we can only scan 20 points at a time hence, A-T). These are the data received from the app which tells us the ping, lost packets, received packets, and whichever network we’re on at each location we monitored. Point A starts at the rec center and then we walked around in a clockwise direction ended up at point T (which is at the Pyramid). (The green spots are where we can received the best signals and red spots are the poorest signals.)

Wi-Fi details for lower campus:

Point A

Signal: 74%

Lowest ping response: 26 ms

Mean ping response: 26 ms

Median ping response: 10 ms

Received packets: 15

Lost packets: 1

Packet size: 1000

Network Name: beachnet+


Point B

Signal: 0%

Lowest ping response: 26 ms

Mean ping response: 26 ms

Median ping response: 0 ms

Received packets: 0

Lost packets: 16

Packet size: 1000

Network Name: beachnet+


Point C

Signal: 88%

Lowest ping response: 9 ms

Mean ping response: 9 ms

Median ping response: 8 ms

Received packets: 16

Lost packets: 0

Packet size: 1000

Network Name: beachnet+


Point D

Signal: 79%

Lowest ping response: 23 ms

Mean ping response: 23 ms

Median ping response: 10 ms

Received packets: 16

Lost packets: 0

Packet size: 1000

Network Name: beachnet+


Point E

Signal: 94%

Lowest ping response: 7 ms

Mean ping response: 7 ms

Median ping response: 7 ms

Received packets: 16

Lost packets: 0

Packet size: 1000

Network Name: beachnet+


Point F

Signal: 100%

Lowest ping response: 5 ms

Mean ping response: 5 ms

Median ping response: 5 ms

Received packets: 16

Lost packets: 0

Packet size: 1000

Network Name: beachnet+


Point G

Signal: 1%

Lowest ping response: 237 ms

Mean ping response: 237 ms

Median ping response: 237 ms

Received packets: 1

Lost packets: 15

Packet size: 1000

Network Name: beachnet+


Point H

Signal: 0%

Lowest ping response: 237 ms

Mean ping response: 237 ms

Median ping response: 0 ms

Received packets: 0

Lost packets: 16

Packet size: 1000

Network Name: beachnet+


Point I

Signal: 26%

Lowest ping response: 54 ms

Mean ping response: 54 ms

Median ping response: 42 ms

Received packets: 11

Lost packets: 5

Packet size: 1000

Network Name: beachnet+


Point J

Signal: 88%

Lowest ping response: 9 ms

Mean ping response: 9 ms

Median ping response: 8 ms

Received packets: 16

Lost packets: 0

Packet size: 1000

Network Name: beachnet+


Point K

Signal: 100%

Lowest ping response: 5 ms

Mean ping response: 5 ms

Median ping response: 4 ms

Received packets: 16

Lost packets: 0

Packet size: 1000

Network Name: beachnet+


Point L

Signal: 4%

Lowest ping response: 774 ms

Mean ping response: 774 ms

Median ping response: 825 ms

Received packets: 8

Lost packets: 8

Packet size: 1000

Network Name: beachnet+


Point M

Signal: 100%

Lowest ping response: 12 ms

Mean ping response: 12 ms

Median ping response: 5 ms

Received packets: 16

Lost packets: 0

Packet size: 1000

Network Name: beachnet+


Point N

Signal: 94%

Lowest ping response: 7 ms

Mean ping response: 7 ms

Median ping response: 7 ms

Received packets: 16

Lost packets: 0

Packet size: 1000

Network Name: beachnet+


Point O

Signal: 94%

Lowest ping response: 9 ms

Mean ping response: 9 ms

Median ping response: 7 ms

Received packets: 16

Lost packets: 0

Packet size: 1000

Network Name: beachnet+


Point P

Signal: 88%

Lowest ping response: 15 ms

Mean ping response: 15 ms

Median ping response: 8 ms

Received packets: 16

Lost packets: 0

Packet size: 1000

Network Name: beachnet+


Point Q

Signal: 50%

Lowest ping response: 21 ms

Mean ping response: 21 ms

Median ping response: 25 ms

Received packets: 16

Lost packets: 0

Packet size: 1000

Network Name: beachnet+


Point R

Signal: 75%

Lowest ping response: 13 ms

Mean ping response: 13 ms

Median ping response: 11 ms

Received packets: 16

Lost packets: 0

Packet size: 1000

Network Name: beachnet+


Point S

Signal: 45%

Lowest ping response: 3 ms

Mean ping response: 3 ms

Median ping response: 3 ms

Received packets: 5

Lost packets: 11

Packet size: 1000

Network Name: beachnet+


Point T

Signal: 30%

Lowest ping response: 72 ms

Mean ping response: 72 ms

Median ping response: 70 ms

Received packets: 16

Lost packets: 0

Packet size: 1000

Network Name: beachnet+


university music and dance department:

Music&Dance

On this map, we only monitor 4 points which can give us the details below. As said above, the points are labeled from A to D. We started from the left near the pyramid then went to the right towards parking lot 12. The generated heatmap shows us the best Wi-Fi spot in the area that we monitored. (Green is where we received the best signal and red is the poorest signal.)

Wi-Fi details for Music/Dance department campus:

Point A

Signal: 79%

Lowest ping response: 15 ms

Mean ping response: 15 ms

Median ping response: 10 ms

Received packets: 16

Lost packets: 0

Packet size: 1000

Network Name: beachnet+


Point B

Signal: 94%

Lowest ping response: 25 ms

Mean ping response: 25 ms

Median ping response: 7 ms

Received packets: 16

Lost packets: 0

Packet size: 1000

Network Name: beachnet+


Point C

Signal: 100%

Lowest ping response: 4 ms

Mean ping response: 4 ms

Median ping response: 3 ms

Received packets: 15

Lost packets: 1

Packet size: 1000

Network Name: beachnet+


Point D

Signal: 94%

Lowest ping response: 7 ms

Mean ping response: 7 ms

Median ping response: 7 ms

Received packets: 16

Lost packets: 0

Packet size: 1000

Network Name: beachnet+


Upper Campus:

Upper

Above is the generated heat map for the upper campus at CSULB. The point A is started at the FA-4 building going around in a clockwise direction. This map has 20 points and as said above, the poorest signal is where the map is red and the best signal is the green area.

Wi-Fi details for upper campus:

Point A

Signal: 94%

Lowest ping response: 33 ms

Mean ping response: 33 ms

Median ping response: 7 ms

Received packets: 16

Lost packets: 0

Packet size: 1000

Network Name: beachnet+


Point B

Signal: 75%

Lowest ping response: 39 ms

Mean ping response: 39 ms

Median ping response: 11 ms

Received packets: 16

Lost packets: 0

Packet size: 1000

Network Name: beachnet+


Point C

Signal: 54%

Lowest ping response: 15 ms

Mean ping response: 15 ms

Median ping response: 14 ms

Received packets: 13

Lost packets: 3

Packet size: 1000

Network Name: beachnet+


Point D

Signal: 74%

Lowest ping response: 13 ms

Mean ping response: 13 ms

Median ping response: 10 ms

Received packets: 15

Lost packets: 1

Packet size: 1000

Network Name: beachnet+


Point E

Signal: 83%

Lowest ping response: 17 ms

Mean ping response: 17 ms

Median ping response: 9 ms

Received packets: 16

Lost packets: 0

Packet size: 1000

Network Name: beachnet+


Point F

Signal: 100%

Lowest ping response: 25 ms

Mean ping response: 25 ms

Median ping response: 4 ms

Received packets: 16

Lost packets: 0

Packet size: 1000

Network Name: beachnet+


Point G

Signal: 63%

Lowest ping response: 273 ms

Mean ping response: 273 ms

Median ping response: 12 ms

Received packets: 14

Lost packets: 2

Packet size: 1000

Network Name: beachnet+


Point H

Signal: 77%

Lowest ping response: 10 ms

Mean ping response: 10 ms

Median ping response: 9 ms

Received packets: 15

Lost packets: 1

Packet size: 1000

Network Name: beachnet+


Point I

Signal: 63%

Lowest ping response: 3 ms

Mean ping response: 3 ms

Median ping response: 3 ms

Received packets: 7

Lost packets: 9

Packet size: 1000

Network Name: beachnet+


Point J

Signal: 17%

Lowest ping response: 27 ms

Mean ping response: 27 ms

Median ping response: 21 ms

Received packets: 5

Lost packets: 11

Packet size: 1000

Network Name: beachnet+


Point K

Signal: 88%

Lowest ping response: 6 ms

Mean ping response: 6 ms

Median ping response: 7 ms

Received packets: 15

Lost packets: 1

Packet size: 1000

Network Name: beachnet+


Point L

Signal: 83%

Lowest ping response: 16 ms

Mean ping response: 16 ms

Median ping response: 9 ms

Received packets: 16

Lost packets: 0

Packet size: 1000

Network Name: beachnet+


Point M

Signal: 88%

Lowest ping response: 7 ms

Mean ping response: 7 ms

Median ping response: 7 ms

Received packets: 15

Lost packets: 1

Packet size: 1000

Network Name: beachnet+


Point N

Signal: 94%

Lowest ping response: 7 ms

Mean ping response: 7 ms

Median ping response: 7 ms

Received packets: 16

Lost packets: 0

Packet size: 1000

Network Name: beachnet+


Point O

Signal: 36%

Lowest ping response: 3 ms

Mean ping response: 3 ms

Median ping response: 3 ms

Received packets: 4

Lost packets: 12

Packet size: 1000

Network Name: beachnet+


Point P

Signal: 88%

Lowest ping response: 13 ms

Mean ping response: 13 ms

Median ping response: 8 ms

Received packets: 16

Lost packets: 0

Packet size: 1000

Network Name: beachnet+


Point Q

Signal: 34%

Lowest ping response: 49 ms

Mean ping response: 49 ms

Median ping response: 35 ms

Received packets: 13

Lost packets: 3

Packet size: 1000

Network Name: beachnet+


Point R

Signal: 23%

Lowest ping response: 71 ms

Mean ping response: 71 ms

Median ping response: 36 ms

Received packets: 9

Lost packets: 7

Packet size: 1000

Network Name: beachnet+


Point S

Signal: 88%

Lowest ping response: 26 ms

Mean ping response: 26 ms

Median ping response: 8 ms

Received packets: 16

Lost packets: 0

Packet size: 1000

Network Name: beachnet+


Point T

Signal: 83%

Lowest ping response: 13 ms

Mean ping response: 13 ms

Median ping response: 9 ms

Received packets: 16

Lost packets: 0

Packet size: 1000

Network Name: beachnet+

Conclusion:

As you can see on the generated maps, the green area are where the best Wi-Fi signal is. On  the  other hand, the red is where the poorest Wi-Fi signal is. The green area is where we want to launch our pathfinder and explore the area for 4 hours. These maps are not done to a 100 percent accuracy but, it will do because we just want to know the general area we can explore.

Sources:

Telstra Wi-Fi Maximiser

CSULB Campus

Wi-Fi image

Spring 2016 3D SMD: Solenoid Valve Trade-Off Study

By Henry Nguyen ( Electronics and Control)

Table of Contents

To satisfy requirement L2-7B:

A solenoid valve for vacuum system shall keep a stable temperature under 160° F during operation.  

Introduction

In order for our machine to be able to pick and place components, we will use a solenoid to restrict the airflow from our vacuum pump when our machine is placing components. We are to test the limits of our solenoid valve in order to see if it is suited for our 3D pick and place machine. A factor to consider is that our plastic tubing can only withstand 160° F or 71° C.

—Equipment and Materials

  1. 12V solenoid valve

Screen Shot 2016-03-27 at 8.33.21 AM

Figure 1. 12V Solenoid Valve


Datasheet Price Pipe Size Orifice Temperature Operation Pressure Dimensions Weight
Datasheet $10.99 1 / 4” 2.5mm -5 – 80 degree Celsius Min. 0kg/cm^2 –

MAX 10kg/cm^2

3.1 x 2.1 x 2 inches 10.4 oz


  1. Non-contact infrared thermometer

Screen Shot 2016-03-27 at 8.33.10 AM

Figure 2. Thermometer

  1. 12V DC power supply (obtained from ET-113)

Procedure

  1. We will be connecting our 12V DC power supply to our solenoid valve in order for our solenoid valve to be kept in the open position.
  2. We shall allow our solenoid valve to be on for 75 minutes and check the temperature of our solenoid valve consistently.
  3. We will also be constantly turning on and off our power supply in order to switch our solenoid valve off an on.

Results

After 75 minutes of run time, we were able to measure the temperature of our solenoid valve. Based on the following data, we were able to conclude that our solenoid valve will heat up rapidly to approximately 82° Celsius but will not heat up more than this. The rated temperature for our solenoid valve is -5°  – 80° C. When running our tests, we found that our solenoid valve heated up more than 80° C.


0 minutes 10 minutes 20 minutes 30 minutes 40 minutes 50 minutes 60 minutes 75 minutes
25° C 55° C 70° C 75° C 80° C 82° C 81° C 82° C


Table 1. Temperature of 12V Solenoid valve over time.

Conclusion

We have decided to return this solenoid valve because it is not suited for our 3D pick and place SMD machine. Since the solenoid valve heats up more than our maximum temperature of 71° C of our plastic tubing, it will not be ideal to use this solenoid. It is possible that our plastic tubing may melt onto our solenoid valve if it heats up pass 71° C.

Reference

Solenoid Valve Image:

DC 12V 1/4 Inch Electric Solenoid Valve for Air Water. (n.d.). Retrieved March 02, 2016, from http://www.amazon.com/dp/B00KKIH1YK/ref=sr_ph_1?ie=UTF8

LiPo Battery safety Spring 2016

Posted By: Luis Valdivia (Project Manager)

Written by: Kevin Nguyen (Electronics and Control)


Table of contents:

  • Introduction
  • Using the IMax B6AC LiPro Balance charger
    • Charging
    • Discharging
  • Using the Voltage monitor system
  • Battery safety bag


Introduction:

LiPo batteries are the most dangerous types of batteries in the world. They are very compact in size yet contain very high power. This high energy density allows them to power devices for longer periods of time compared to other types of batteries but also makes them very explosive. LiPo batteries may explode and catch fire if overcharged, undercharged, charged too fast, undercharged too fast, or punctured. Although this seems scary, if handled properly, LiPo batteries can be just as safe as any other battery and will outperform most other batteries. This blog post will help you minimize the risk and reap the rewards of LiPo batteries.LipoBattery safety

iMax B6AC LiPro Balance Charger:

Most LiPo explosion incidents happen due to improper charging. This manual will help the user become familiar with the B6AC Lipo Charger to charge or discharge the lipo battery for the UFO quadcopter. Here are step-by-step guides on how to charge and discharge using the B6AC charger.

Lipo charger


  • Charging
      • Power charger from outlet with AC to DC adapter.
        • Once the charger is plugged into the wall, it should automatically turn on.  
      • Sift through the different modes using the DEC./◀ and INC./▶ buttons and through the options using the START/Enter button .
      • Select battery type using the BATT. TYPE/Stop button.
        • Be sure to select the correct battery type. There are different techniques for charging different batteries. Choosing the wrong battery type may burn down your house.
      • Select charging mode.
        • The preferable charging mode is Balanced Charging since it charges all cells evenly. To be able to use this mode you must have a balance connector on your battery. This is used to detect the voltage levels of each individual cell so that the charger can charge the appropriate cells depending on its level.
      • Select charging current.
        • More charging current will result in a faster charge. The general rule is to use the same value as the rated capacity(i.e. 4500mAH = use 4.5A charging current). It is acceptable to select a lower charging current, but do not choose a higher charging current unless specified in your batteries’ specs. Charging current may be limited by your AC to DC adapter. Since our wall adapter was only capable of producing 1A, we charged with a 1A charging current which might take some time.
      • Select battery cell count.
        • i..e. 4 cell battery = 4S
      • Plug the balance connector into the appropriate location on your charger depending on the amount of cells of your battery.
        • Pay attention to polarity.
      • Connect positive and negative ends of battery to charger.
        • An adapter is necessary to connect the two.
        • Connect the adapter to the charger before connecting the battery; this is to prevent shorting the battery. Shorting for long periods of time may cause fires.
        • When disconnecting, take the battery off first before the adapter; this is to prevent shorting the battery.
      • Once everything is plugged in and the correct options are selected, press and hold the START button for 3 seconds.
      • A screen should appear showing the amount of cells the battery is reading vs. the amount of cells the user set for charging.
        • If these two values match(R=S), press START/Enter to begin charging.
        • Once the battery is fully charged, the battery charger will beep to alert the user. Never charge past 4.2V per cell.
        • When storing the battery, it is best to charge no higher than 3.7V.   
      • While charging, the DEC./◀ and INC./▶ buttons can be used to view total voltage or individual cell voltages.
      • Press the BATT. TYPE/Stop button to stop charging.


  • Discharging
  • Select battery type.
    • Select discharge mode.
    • Select discharge current.
    • Press and hold Start for 3 seconds to begin discharging.

Note: Charging and Discharging too fast may damage the battery. Double check the charging/discharging rates to make sure it is compatible with your battery.                


Voltage Monitor Alarm System:

To prevent the battery from discharging to dangerous levels, a voltage monitor alarm system is used to alert the user of low voltage levels. Below is a quick setup guide for the low voltage alarm.

Lipo alarm

  • Connect the Balance Charging Connector to the Alarm.
    • The back of the alarm has labels showing the connections of each pin. Make sure the polarity is correct.
      • Once the Alarm has been successfully installed, an initial beep will sound to indicate that it is operating properly.
  • Press button at the top of the Alarm to select the lower limit of the voltage level.
    • This voltage level is used to compare against each cell of the battery. Once a cell goes below this value, the alarm will go off until removed.
    • LiPo battery cells should never go below 3V. It is recommended to set the lower limit to 3.2V to give some cushion time to remove the battery from the device.
  • After the device is connected to the battery, the 7-Segment display will display the value of the battery as well as the value of each individual cell.


Battery Safety Bag:

safety bag

When not in use, it is recommended to store the LiPo in a battery safety bag. In the case of an explosion, these bags are flame retardant and will prevent the fire from spreading. Only one battery should be stored in each bag. If more than one is stored in a bag, the effectiveness of the bag will be reduced and risk of burning down your house will increase. Stop using batteries that appear to be damaged. Overcharging or undercharging may cause gases to leak and make the battery appear puffy. The chemicals in the battery will ignite when exposed to air.

Works Cited:

  1. “The World’s Most Dangerous Battery.” The World’s Most Dangerous Battery. N.p., n.d. Web. 26 Mar. 2016. <http://www.atbatt.com/batterytimes/dangerous-battery>.
  2. “A Guide to Understanding LiPo Batteries – Roger’s Hobby Center – Radio Control (R/C or RC) Cars, Boats, Airplanes, Puzzles, Plastic Models, & Trains – Saginaw, MI.” A Guide to Understanding LiPo Batteries – Roger’s Hobby Center – Radio Control (R/C or RC) Cars, Boats, Airplanes, Puzzles, Plastic Models, & Trains – Saginaw, MI. N.p., n.d. Web. 26 Mar. 2016. <http://www.rogershobbycenter.com/lipoguide/>.
  3. N.p., n.d. Web. <https://www.pololu.com/file/download/iMAXB6ACmanual.pdf?file_id=0J525>.

Spring 2016 RoFi: Servo Driver, Accelerometer and Gyroscope Testing

Christopher Andelin (Project Manager)

Mario Ramirez (Systems Engineer)

Qui Du (Manufacturing Engineer)

Andrew Laqui (Electronics and Controls Engineer)

Henry Ruff (Electronics and Controls Engineer)

Servo Driver Testing

Andrew Laqui (Electronics and Controls Engineer)

Henry Ruff (Electronics and Controls Engineer)


Servo Driver Part Number: PCA9685

Link to Adafruit Servo Driver “Using the Adafruit Library” page https://learn.adafruit.com/16-channel-pwm-servo-driver/using-the-adafruit-library

ServoDriverFritzingBreadboard

Figure 1: Servo Driver Fritzing Diagram

ServoDriverFritzingSchematic

Figure 2: Servo Driver Fritzing Schematic

Link to Adafruit library for Fritzing https://github.com/adafruit/Fritzing-Library

A Basic Stamp HomeWork Board with a built in 5V regulator was used to regulate the voltage from a 9V battery to power the servo. When the old Detrum UBEC regulator was used, the Tower Pro SG90 servo only made a buzzing noise; it was unresponsive. When we switched to the Basic Stamp HomeWork Board, the servo swept back and forth as it should.

ServoDriverCamera_compressed

Figure 3: Servo Driver Testing

The code was modified to only run the first servo (servonum = 0) rather than incrementing through 8 servos.

The code was modified from the Adafruit Servo Driver Library for Arduino Uno to match the pulse width of the Tower Pro SG90 servo.

Link to Tower Pro SG90 specifications http://www.servodatabase.com/servo/towerpro/sg90

#define SERVOMIN  500    // this is the 'minimum' pulse length count (out of 4096)

// Original value was 150. Value of SG90 is 500

#define SERVOMAX  2400 // this is the 'maximum' pulse length count (out of 4096)

// Original value was 600. Value of SG90 is 2400

Link to Adafruit Servo Driver “Hooking It Up” page https://learn.adafruit.com/16-channel-pwm-servo-driver/hooking-it-up

According to the “Hooking It Up” page, an electrolytic capacitor is added to handle quick changes in voltage. Since RoFi will be using 12 servos, a 1200 µF capacitor will be used.

At the moment, the servo driver has the pins that connect the GND, VCC, SCL, and SDA to the Arduino Uno soldered to the top of the board. These will have to be unsoldered and soldered again with the pins facing the bottom of the board in order to plug the servo driver directly into RoFi’s new PCB. If the pins are left the way they are, wires will be needed to jump the pins to the PCB.


Accelerometer and Gyroscope Testing

Andrew Laqui (Electronics and Controls Engineer)

Henry Ruff (Electronics and Controls Engineer)


Link to MPU-6050 test code http://playground.arduino.cc/Main/MPU-6050

MPU-6050FritzingBreadboard

Figure 4: Accelerometer and Gyroscope Fritzing Diagram

MPU-6050FritzingSchematic

Figure 5: Accelerometer and Gyroscope Fritzing Schematic

Link to MPU-6050 for Fritzing http://fritzing.org/projects/mpu-6050-board-gy-521-acelerometro-y-giroscopio

Once the MPU-6050 was connected according to the Figure 4 fritzing diagram and the code was uploaded to the Arduino Uno, the Arduino began displaying values for acceleration and tilt in the x, y, and z directions and temperature.

AccelGyroCamera_compressed

Figure 6: Accelerometer and Gyroscope Testing

Spring 2016 3DOT Goliath, 3D Printing Requirement: “Round One”

By: Rickeisha Brown (Manufacturing Engineer)

As a level one requirement, the customer requests to refrain from exceeding a total of 6 hours 3D printing time and not to exceed two hours per printed component. The customer has a project total budget of which ultimately limits the amount of spending power per division. Printing Cost estimates which is of total budget.

Maker’s Society is the organization handling our 3D prints. Their printers can print multiple parts at a time, they’re conveniently located on the campus of CSULB, and are reasonably priced to $5 per hour. Visit their website for more details regarding Maker’s Society and the services they offer: http://lbmakersociety.org/about-us/.

I submitted my design to Carlos Vergara1, the AESB representative, and informed him of my 6 hour printing requirement. He uploaded the parts to a program which examines each component and estimates total printing time down, to the minute.

1

Figure 1: The table above shows the trade-offs between strength, quality, low cost, speed vs. layer height. 2

2


Figure 2: Maker’s Society printing time estimates for the original body with 0.3 mm layer height: 8 hours and 24 minutes.

Figure 2 shows the results for total printing time of Goliath components with 0.3 mm layer height, with 0.2 mm being an ideal layer height based on Figure 1.

This does not meet level one requirement, so we must revert to Plan B: reducing the amount of components which make up our body from 6 to 3 components, sides (2), and cellphone and periscope compartment (1).

Here are the results:

3


To my surprise, the printing time did not decrease!

I requested that Carlos increase the layer height to 0.4 mm which will decrease printing time and help our team meet the 6 hour printing time requirement. Here are the results:

4

For 3 components, the total time still exceeds 6 hours. Therefore, I will go back to the drawing board readjust components thickness.

References:

1-Carlos Vergara, AESB Representative for Maker’s Society, E-mail: carloslbvergara@gmail.com

2- “What Is the Influence of Infill %, Layer Height and Infill Pattern on My 3D Prints?” 3D Matter. N.p., 10 Mar. 2015. Web. 23 Mar. 2016.


Spring 2016 3DOT Goliath, PM Tool ” Smartsheet”

By: Ayman Aljohani (Project Manager)

The major role of PM is to successfully manage the team to meet customer requirements thus have a functioning product at the final demo. That couldn’t be done without keeping track of project’s critical path to know what is done as per schedule and what is delayed. Knowing that would provide the PM with multiple options and solutions to steer the project toward a successful result.

One important tool of project management I used is Smartsheet:

Smartsheet1

Smartsheet is 30 days free, after that there are 3 different plans to choose from. The basic plan which I used costs $10 monthly for annual plan, or $13 for a monthly plan:

Smartsheet 4

Once you sign up, you will have an access to variety of templates to choose or a blank sheet:

Smartsheet 5

This is a video that explains creating new project sheet:

Creating New Project Sheet


Smartsheet 6

With Smartsheet you can easily generate Waterfall diagram “Gantt Chart”, here is a video on how to generate it :

Gantt Chart View


What makes Smartsheet powerful project tool is that it allows collaborators to work on it as well, depending on the access given to them by the owner of the sheet (Project Manager), they can be editors, viewers, or admin. Editors will have limited access on the sheet to edit tasks, i.e completion percentage. However, columns or rows that the owner doesn’t wish editors to have access to should be locked :

Smartsheet 7

To lock a column or row :

1-Highlight row or column

2-Right click

3-Lock Row, or Column


Once a task is assigned to someone, they can be notified via email. The following video shows how to set alerts and reminders:

Alerts And Reminders


One cool feature of Smartsheet is iPhone App. Project manager can easily manage their projects using Smartsheet app.

Smartsheet apps

This video explains how to use the app to upload photo on Smartsheet:

how to upload photo to Smartsheet using the app


If a team member wants some clarification on assignment, they can start a discussion with PM on Smartsheet discussion column:

Smartsheet 9

Smartsheet 8


The “attach” option allow collaborators to add copy of their work to keep track of project documents.

Smartsheet 10


Once the sheet is ready to be shared, “Sharing” at the bottom of the sheet provides owner the option to share the document with collaborators:

Smartsheet 11


Burn Down is an important chart PM should keep an eye on thus Smartsheet allows PM to generate it easily. To do that, PM should add ” Planned Assignments” column, ” Planned Start Date”, ” Planed End Date” . Then highlight these columns and generate report.

Also, you can export the project sheet to Excel or MS project and generate the Burn Down from there.

Smartsheet 12

Sources:

Smartsheet website