Preliminary Project Plan
Sabina Subedi (Project Manager)
Adan Rodriguez (Mission, Systems & Test)
Jose Alcantar (Electronics & Controls)
Nick Lukin (Design & Manufacturing)
Table of Contents
Work Breakdown Structure (WBS)
By Sabina Subedi (Project Manager)
The WBS shows all the work that is to be completed by the Pathfinder – Chassis group. The WBS is arranged into three main sections or divisions – Mission Systems & Test, Electronics & Controls and Design & Manufacturing, where each section is a responsibility of the corresponding division member. The three sections are then divided into various groups, which include specific sets of tasks that are relevant to the group.
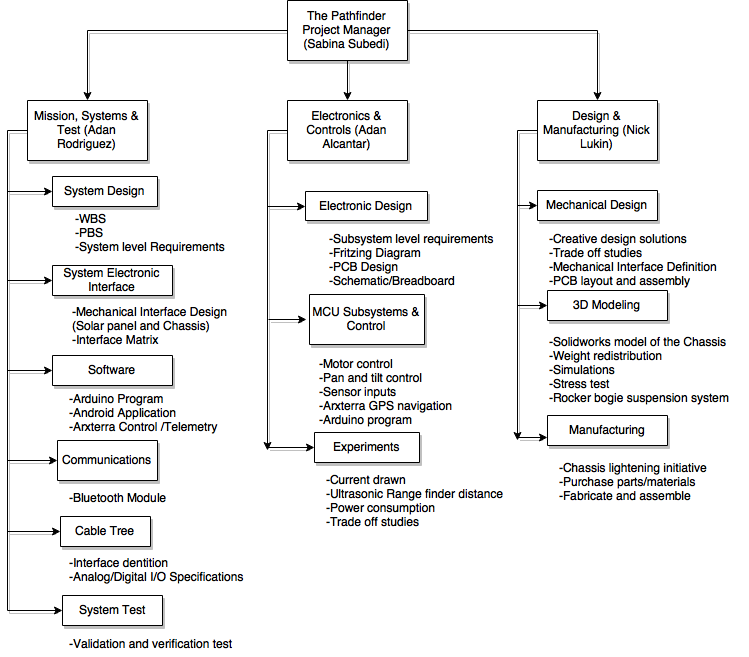
Figure 1: Work Breakdown Structure
Project Schedule
By Sabina Subedi (Project Manager)
Top Level Schedule
The top level schedule below was created using the generic schedule provided on the class website. This schedule consists of all tasks that are to be completed before the end of the semester, December 15th, 2016. The project milestones are broken down into four phases: Planning, Design, Assembly and Project Launch. The tasks within the different phases are then divided up by the divisions.
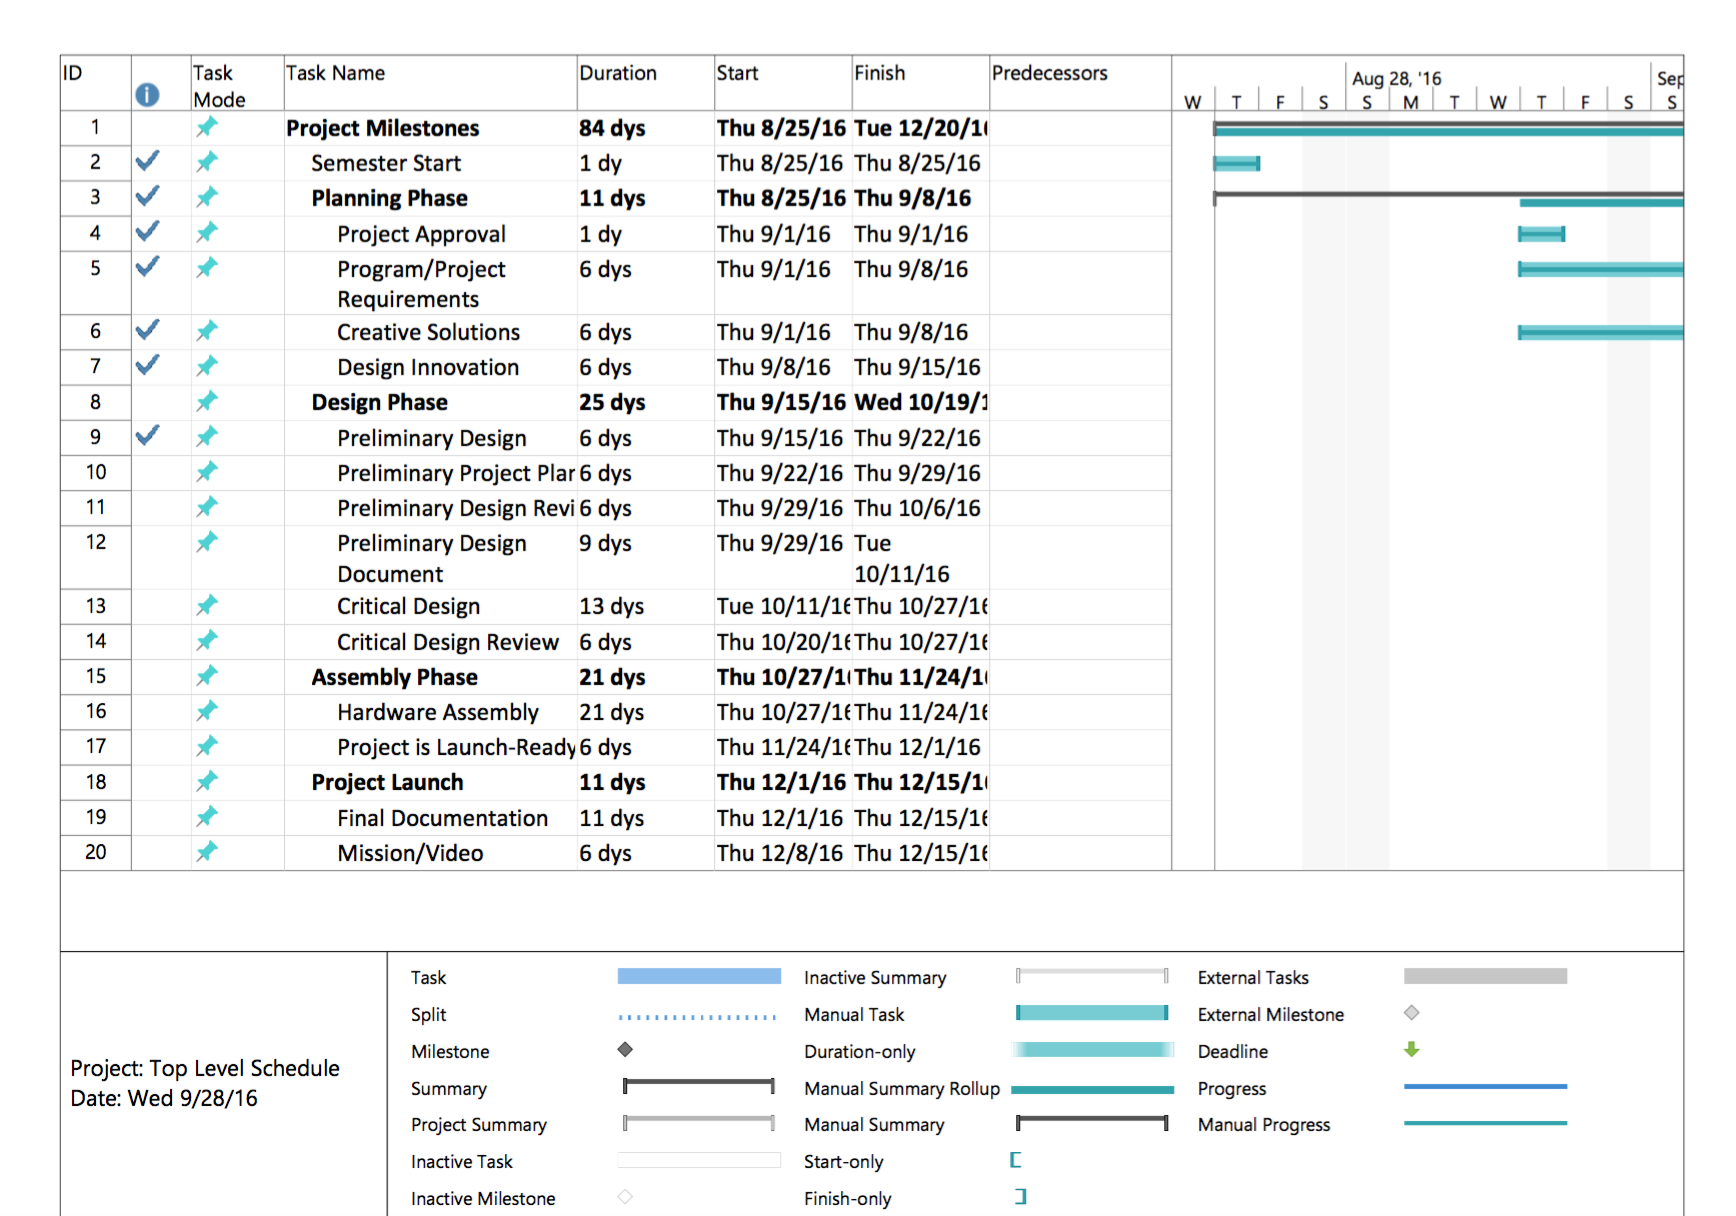
Figure 1: Top level schedule (Generic)
System/Subsystem level tasks
The generic top level schedule was then modified to include all system/Subsystem level tasks in accordance with the WBS above. All division members are assigned specific tasks that they are responsible for, per “Job Descriptions” document available on the class website. Main tasks then were broken down into sub-tasks, if applicable. All tasks include start and finish dates, as well as percent complete. Blue check mark denotes tasks that are 100% complete.

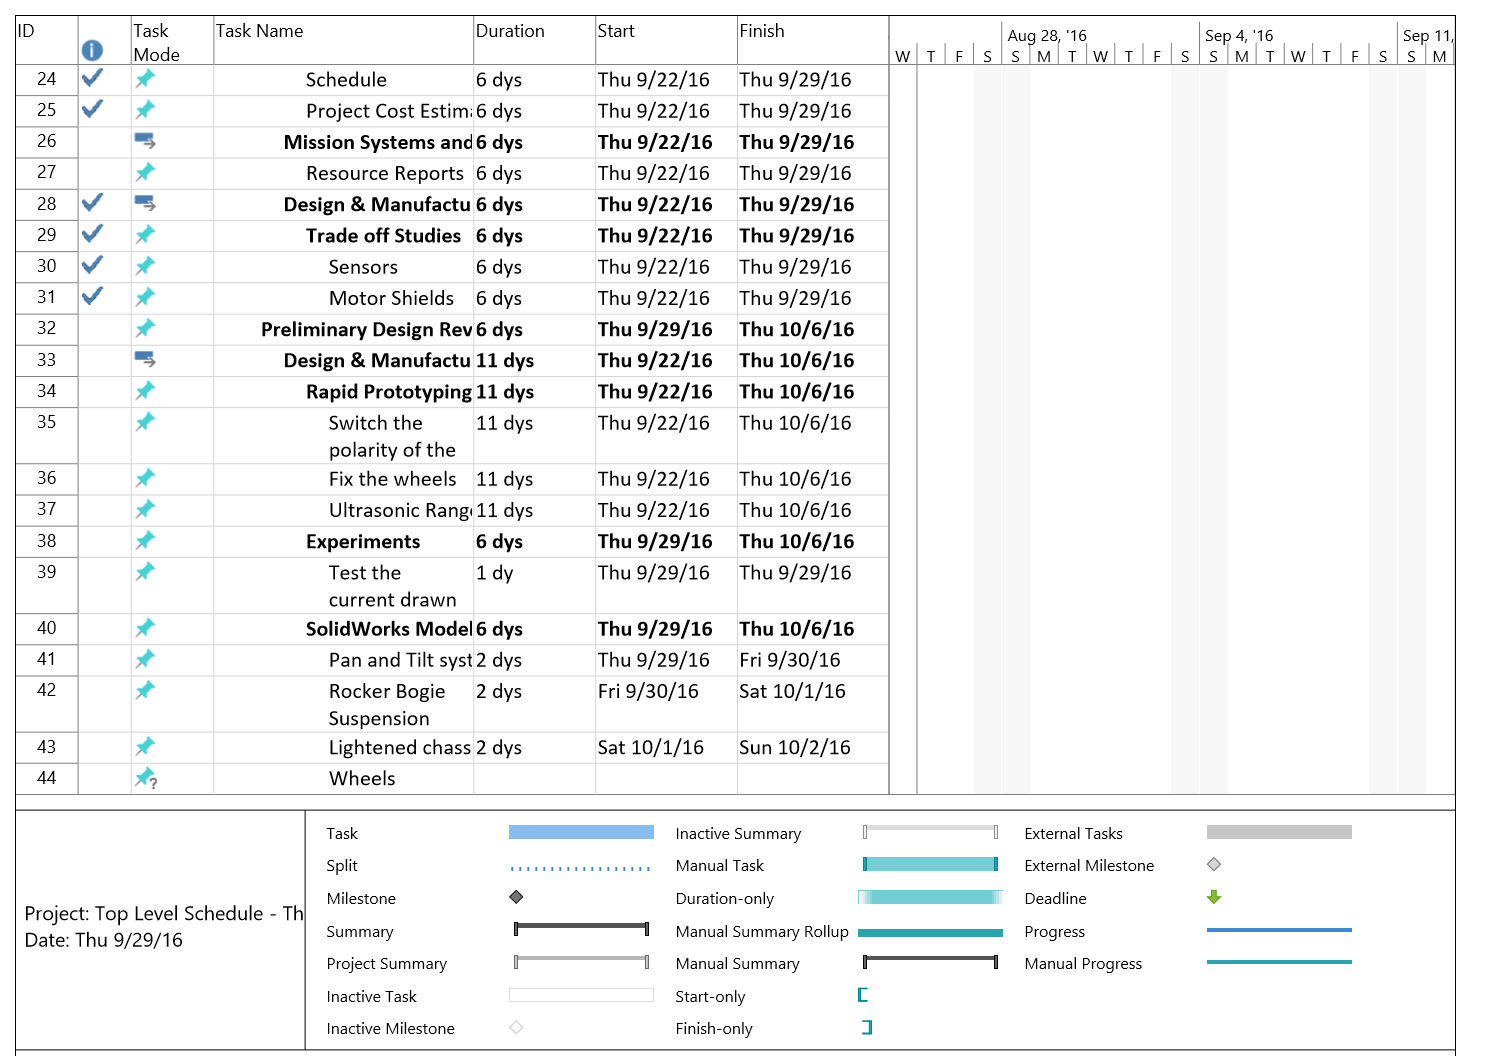
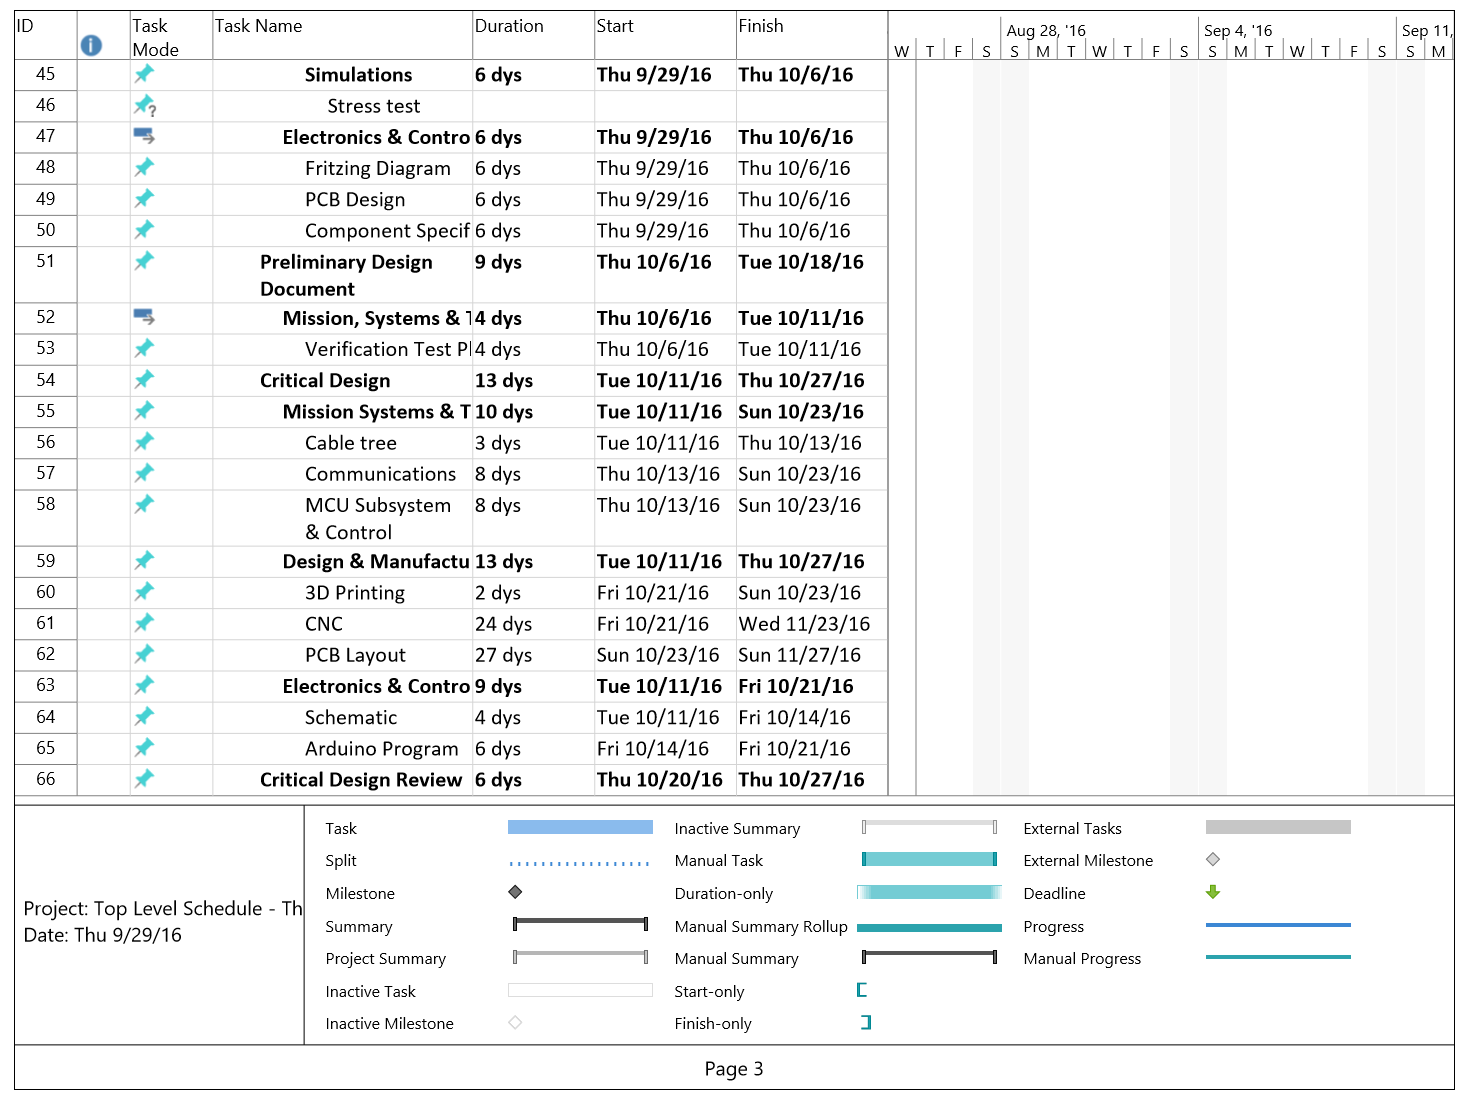
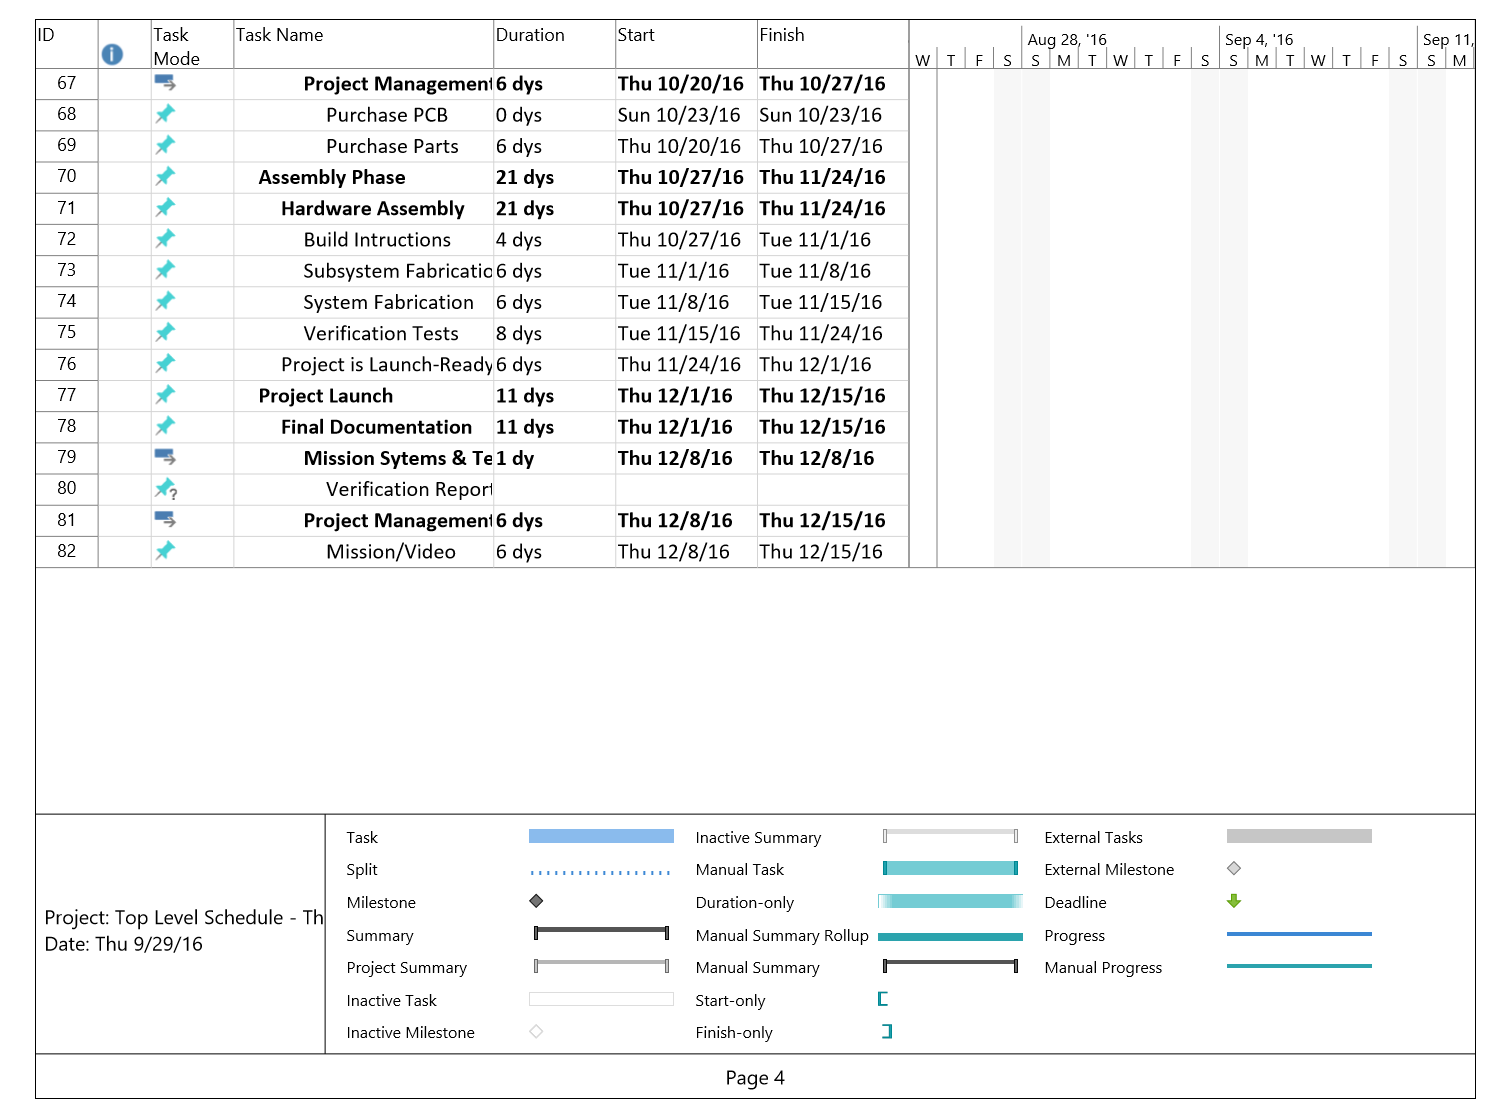
Figure 2: Schedule including System/Subsystem level tasks
Burn Down and Project Overview
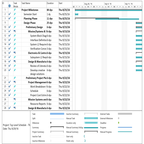
The burn down chart below shows how many tasks are completed and how many are left. The project overview graph shows the percent completed as of today, September 29th 2016.
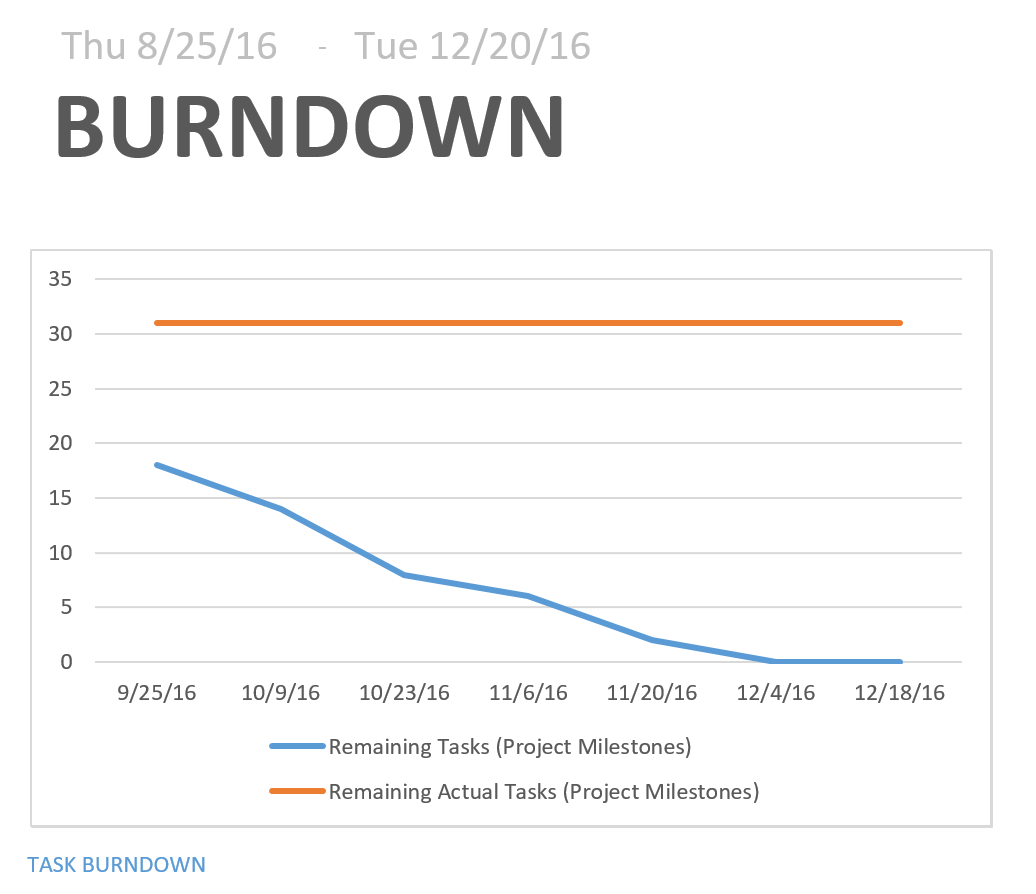
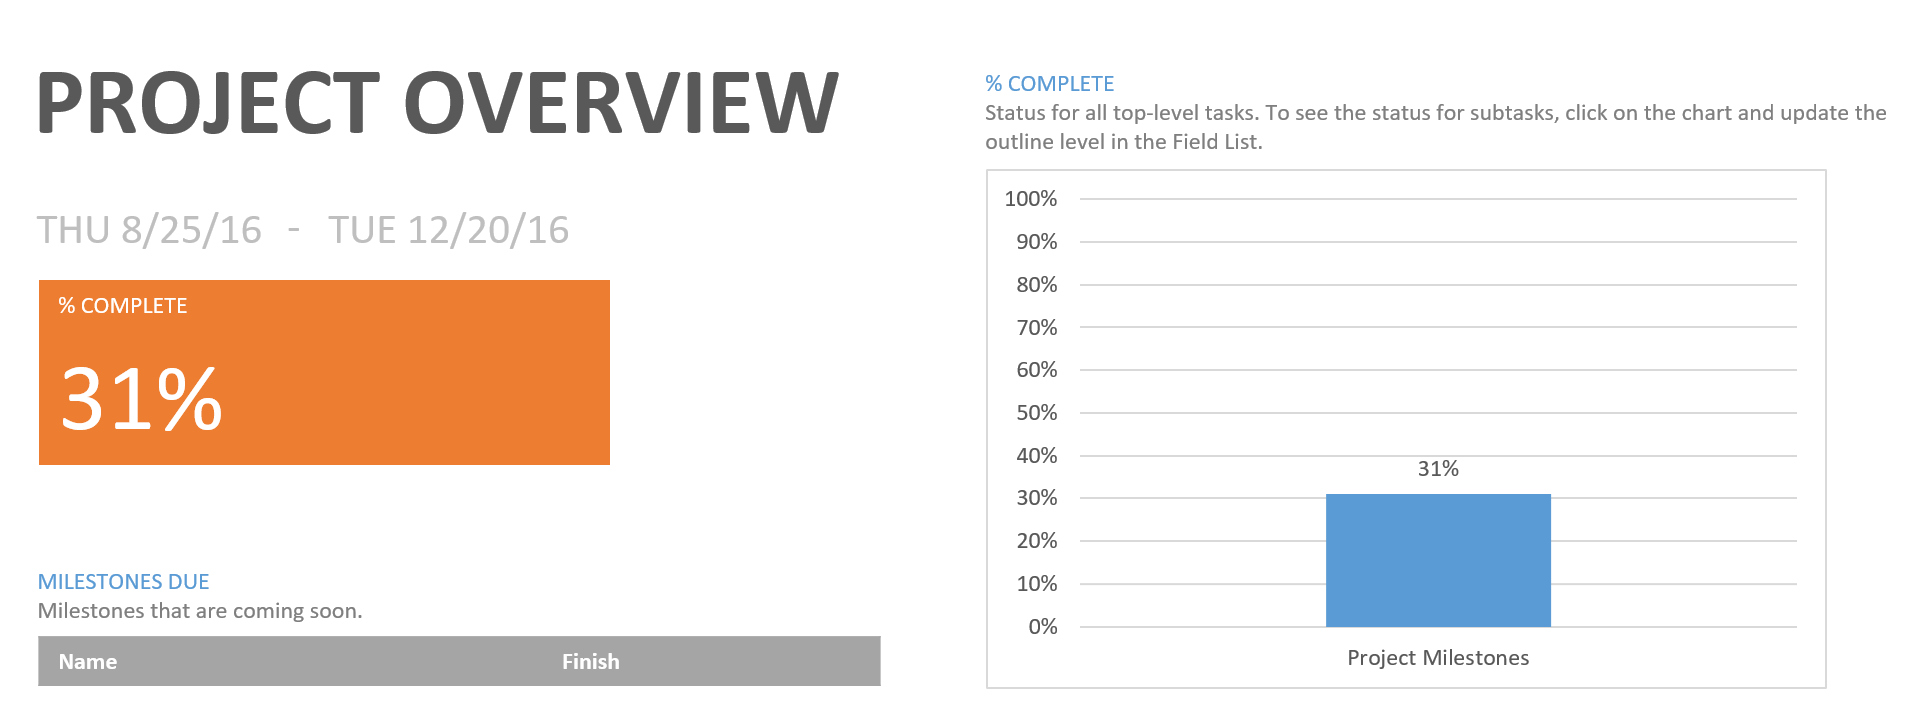
Figure 3: Task burndown chart along with project overview graph
System Resource Report
By Adan Rodriguez (Mission Systems and Test Engineer)
Cost Allocation Report
This cost report is a rough estimate of the expected cost of each component on the Pathfinder. Our expected prices for each item excluded tax and shipping price. Tax and shipping prices were included in the Uncertainty category. Some of the items were marked at $0 for expected price because the item was either already on the Pathfinder from previous semester or the item was given to the team. Since there is no budget requirement, the Project Allocation was determined by adding up the expected price of each item and choosing an amount slightly higher than the total expected price.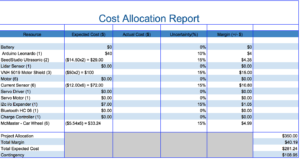
Figure 4: Cost Allocation Report
Power Allocation Report
This power report displays the expected current drawn by each component that will be drawing power from the battery. The team had trouble identifying the current that would be drawn by the VNH 5019 motor shields. For now we have used rough estimate of the current drawn by the VNH 5019 motor shield by using the same current rating of the Arduino Leonardo. The battery being used on the Pathfinder has a power rating of 10,000 mAh. We considered the 4 hour duration of the mission in order to come up with the Project Allocation value. We simply divided the power rating of the battery by 4 in order to come up with a Project Allocation of 2,500 mAh.
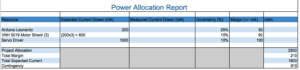
Figure 5: Power Allocation Report
Mass Allocation Report
This mass report is a rough estimate of the expected weight of each component on the Pathfinder. Some of the expected weight values are rough estimate because some of the item weight values were tough to find. Rough estimates were made relative to similar size of items. For example, the SeedStudio Ultrasonic sensors were estimated to weigh a fraction of the weight of the VNH 5019 motor shield because we had accurate weight values for the motor shields. The Mass Allocation Report will be updated once we actually weigh items with a scale. Since there is no weight requirement, the Project Allocation was determined by adding up the expect weight of each item and choosing an weight slightly higher than the total expected weight.
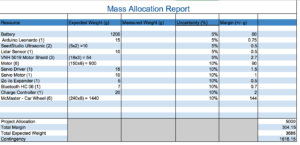
Figure 6: Mass Allocation Report
Project Cost Estimate
By Sabina Subedi (Project Manager)
The total expected cost is $281.24, based on the cost allocation provided above. The cost allocation report consists of rough approximations of the expected cost of each component. The components listed have not been purchased. Further trade-off studies are to be done before any purchases are made. Therefore, the total estimated cost is subject to change as the project progresses.
Source Material:
Preliminary Project Plan: http://web.csulb.edu/~hill/ee400d/Documentation%20Lecture%20Series/05%20Preliminary%20Project%20Plan.pdf
Generic Schedule: http://web.csulb.edu/~hill/ee400d/Lectures/Week%2005%20Project%20Plans%20and%20Reports/c_Generic%20Schedule.pdf
Job Descriptions:
http://web.csulb.edu/~hill/ee400d/Lectures/Week%2001%20Welcome/c_Job%20Descriptions.pdf
Resource Report: