Spring 2016 A-TeChToP ECG Demonstration
By: Stephen Cortez (Electronics Engineer)
For the electrocardiogram (ECG) demonstration, the group was required to generate a real-time ECG signal from a subject and transmit the signal to over to the Arxterra website either on a phone application or a computer through Bluetooth. The following is the process taken in order to develop the ECG circuit and develop communication both from the Bluetooth module to the phone and from the phone to the Arxterra app.
First, a basic ECG design was found [1] and used as a template for this demonstration’s circuit. In order to view the signal, the circuit’s output was connected to an analog input on the Arduino and read using some basic code. Three electrodes were used to acquire the signal, with V+ placed on the lower abdomen, V- on the upper right chest, and reference ground on the upper left chest, forming what is known as Einthoven’s Triangle [2]. Then, the serial plotter feature on Arduino was used to plot the ECG signal in real-time. Modifications were made to the circuit with the addition of a notch filter and tweaking the values of the low pass filter’s resistors. This was done since the first attempt to acquire an ECG signal resulted in a QRS Complex that was of the same amplitude as the T-Wave. Thus, the cutoff frequency of the low pass filter was raised in order to allow for the entire QRS Complex to be seen. Once the circuit was built and modified and displayed, the Bluetooth module was connected to the Arduino [3]. Using an HC-06, an Android phone was used to download the Arxterra app and make contact. Once synched, the Systems Engineer, Omar Rojas, and Project Manager, Cody Dunn, used an LED to test the control from the phone. This test included dimming the LED and gradually brightening it on command. Once this successful connection was made, Omar and Cody proceeded to test the telemetry of the device from the Arxterra app. Currently, there is little success with this, where small amounts of incoherent data can be transferred.
Arduino Code:
int ECG = 0;
void setup() {
Serial.begin(115200);
}
void loop() {
ECG = analogRead(A0);
Serial.println(ECG);
delay(2);
}

Figure 1: This image shows the instrumentation amplifier followed by the high pass filter and low pass filter [1].

Figure 2: Here the entire circuit can be seen with its connections to the Arduino. The Arduino was then connected to the computer from this setup using a USB cable [2].

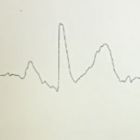
Figure 3: These are the first results from when the ECG circuit was first tested. The filters are clearly producing a recognizable signal in terms of P-wave, QRS Complex, and T-wave [3].

Figure 4: This image shows the Bluetooth module used and how it’s resistor connections were made. To connect to the Arduino, the R0 pin was connected through a resistor to the Tx pin and the T0 pin was connected directly to the Rx pin from the module to the Arduino respectively.

Fig 5. Complete ECG Circuit Connected to Arduino Uno

Fig 6. Results from Initial Testing on Arduino Serial Plotter

Fig 7. HC-06 Bluetooth Module Connections
References:
[1] – J.Dominquez.(2013). ECG Circuit Class Project. [Online]. Available:https://www.youtube.com/watch?v=Uj9OXNg_p78
[2] – R.E.Klabunde.(2016).Electrocardiogram Standard Limb Leads (Bipolar). [Online]. Available: http://cvphysiology.com/Arrhythmias/A013a.htm
[3] – Instructables.(2015).Cheap 2-Way Bluetooth Connection Between Arduino and PC.[Online]. Available: http://www.instructables.com/id/Cheap-2-Way-Bluetooth-Connection-Between-Arduino-a/