Spring 2017 BiPed Preliminary Project Plan
Alexander Clavel – Project Manager
Jacob Cheney – Missions, Systems, and Tests
Abraham Falcon – Electronics and Control
Mikaela Hess – Manufacturing and Design
Phong Nguyen – Manufacturing and Design
Table of Contents
Work Breakdown Structure (WBS):
By Alexander Clavel (Project Manager)
Figure 1: WBS
The Work Breakdown Structure shows the responsibilities and tasks of each member of the team. It breaks down the individual tasks and specifies exactly which division and or person it falls under. Figure 1 shows the breakdown for the BiPed Project. The structure was derived from working with the level 1 requirements previously established, the product breakdown structure, as well as the different design innovation methods we used. To set specific tasks, we had to look at what had to be done on the product as well as what we could do. These can all be referenced to the Spring 2017 Preliminary Design Document that was completed previously.
Project Schedule:
Top Level & System/Subsystem Schedule:
Figure 2
Figure 3
The project schedule gives a timeline overview of the work that needs to be done and it what time frame it needs to be completed in. Figure 2 depicts the top level schedule and the entire timeline of the BiPed project. The schedule is broken down into 4 phases which include planning, design, assembly, and project launch. The planning phase mainly consists of research required for the project as well as coming to a clear definition of the mission objectives. After the planning phase comes the designing of the BiPed. Considering that a BiPed has yet to be built using DC motors, this is proving to be a difficult part of our engineering process. Assembly comes next with project completion and project launch in conclusion.
In Figure 3 the schedule is broken down even further to specify tasks for each individual. These tasks can be traced back to the Work Breakdown Structure and include purchasing components to modeling and prototyping. Some of these jobs are ongoing throughout the project while some have specific deadlines that need to be met.
Burndown and Project Percent Completion:
Figure 4
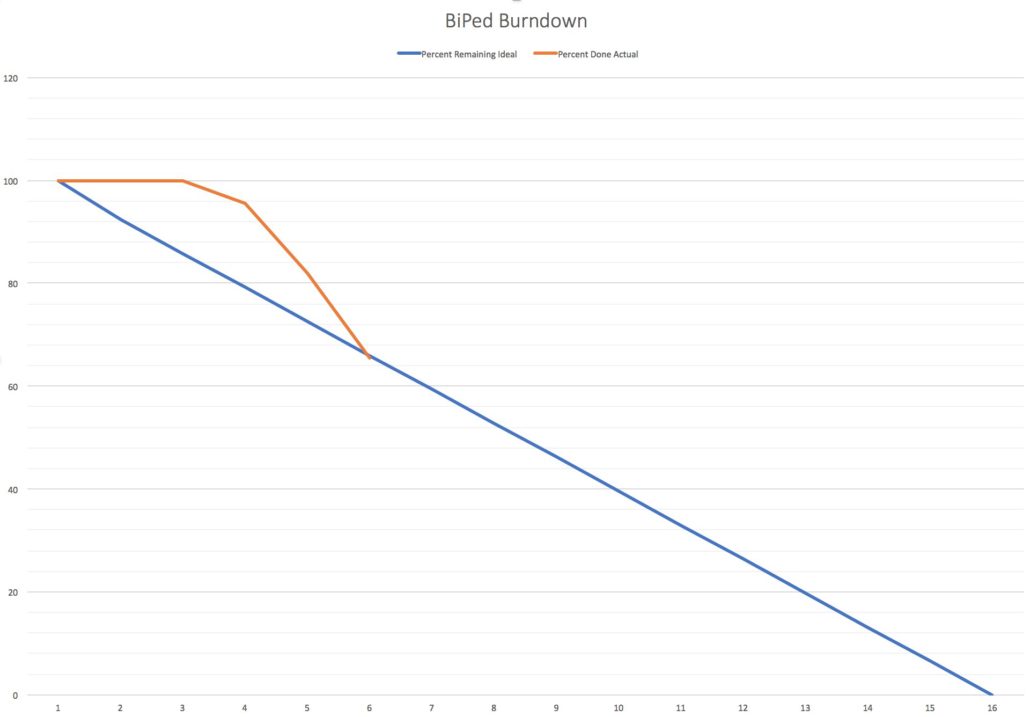
Figure 4 is a representation of our progress by percent. The vertical axis is a measurement of the percentage of tasks that need to be completed while the horizontal axis is the number of weeks. The blue line is the ideal percentage of work that should be done while the orange line is the percentage of work that we have actually done so far. We fell behind in the beginning in terms of tasks that need to be done but we were able to make up about 30% of the work. Most of that work is still currently in progress and not yet complete.
System Resource Reports:
By Jacob Cheney (Missions, Systems, and Test)
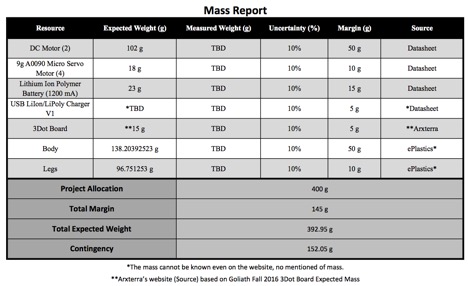
The Mass Report shows the weight of each individual component of the system and the total of all of them combined. For some of our parts, we looked at previous semesters to get a better approximation of how much some of these components weigh. Others were found elsewhere on the web or measured by the manufacturing engineer. For the entire system, our initial calculations of the Total Expected weight came out to 392.95 grams. This lead to a Total margin of 145 grams and a Contingency of 152.05 grams.
The power resource report shows the division of current throughout the Biped system. Current estimates for each component are based on their respective datasheets. Our calculations for the total expected current came out to be 1150 mA. This left us with a total margin of 610 mA and a contingency of 660 mA.
Project Cost Estimate:
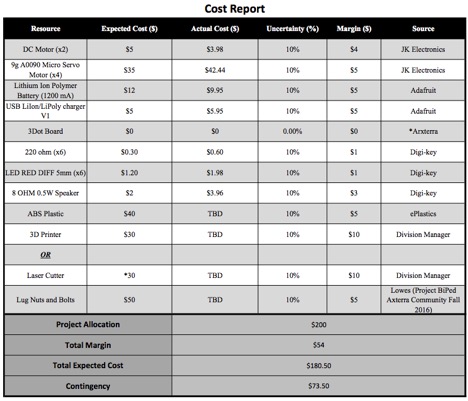
The Cost Report lists all of the parts and materials needed along with the purchase price for each. The Total Expected Cost for everything came out to $180.50 with a Total Margin of $54 and a contingency of $73.50.


