Goliath Fall 2016
Updated MaxSonar Field of View and Resolution Test
By: Sou Thao (Electronics and Control Engineer)
Approved by Kristen Oduca (Project Manager)
Table of Contents
Introduction
Requirements
- The Goliath shall follow the BiPed at a distance of 20 inches with 15% margin of error.
- Goliath should use triangulation to find the location of the Biped.
In order to create an effective control algorithm and to make Goliath run autonomously, we needed to understand the MaxSonar Sensor’s Field of View. The field of view is what the sensors are able to see, and its resolution represents how it is able to differentiate an object’s position as the object moves. To determine the boundaries of the sensor’s field of view, we can create graphs and plot an object’s position as it moves around the sensors. Thus, we will be able to determine the sensor’s resolution along the x and y axis and its boundaries, which will help us in developing our code.
Experiments
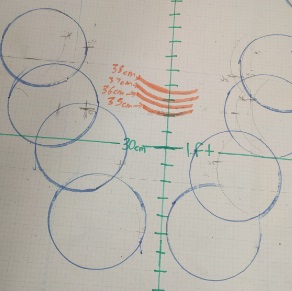
To perform the experiments for determining the sensor’s field of view, we followed the procedures RiGonz used to determine the field of view for the HC-SR04 ultrasonic sensors [1]. First, we needed to graph each sensor and determine the boundary points where the object is no longer detected. To set up the experiment, we taped graph papers together and labeled our graphs by inches and feet shown in Figure 1.
Next we taped our sensor to the end of one side of the graph and moved a 5 inch cylinder, the size of BiPed, around the sensor. We noted where the sensor is not able able to detect the object, and moved the object around the left side of the sensor and continued onto the right side shown in Figure 2 and 3.
After we were able to determine the boundaries of the sensor, we needed to graph the sensor’s resolution along the y axis. As we placed an object in front of the sensor, we slowly moved the object forward and noted where the sensor’s value changed. Then we physically measured the change noted on the graph which yield a vertical resolution of about 1cm shown in orange in Figure 4.
In turn, this represents that the sensor is able to determine if an object has moved along the vertical axis if it is 1cm or farther away. After performing these tests with one of the sensors, we performed these same tests with the other sensor, which gave us the same results. Thus we were able to verify that both sensors worked and performed in a similar fashion shown.
Next we created the same graph as we did in the first experiment and plotted the boundaries of the cross region from both sensors. In order to plot these boundaries, we moved the object until one sensor is out of view while the other one still sees the object. Therefore, by doing this experiment, we created the boundaries where both sensors crossed shown in Figure 6 as the black cylinders. By looking at figure, an object should be within the black cylinders in order for both sensors to detect the object.
Next we determined the vertical resolution along the y axis similar to the first experiment which yield a resolution of 1cm. Last but not least, we needed to determine the horizontal resolution along the x axis. In order to do this, we marked the horizontal line in orange where 20inches was located in front of the sensors shown in Figure 6. Then as we moved the object across this 20 inches line, we marked where the values of the sensor changes. From the values we determined the horizontal resolution across the readings was very close to 3. Although we can distinguish between 10 readings, these readings came from different combinations of the sensor’s value between 49, 50, and 51 at 20 inches or 50cms away.
Determining if BiPed Can Be Tracked Within Range of 20 Inches
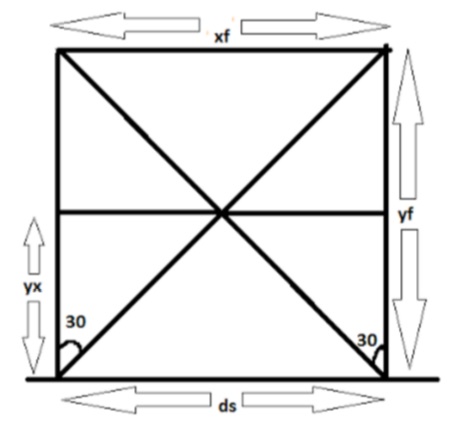
In order to see if our sensors will be able to track BiPed at a distance close to 20 inches away, we have to determine where both sensors’ field of view crosses, which will give us the minimum distance we can follow BiPed. Because the sensor’s field of view is about 30 degrees according to the previous blog post, if we angled the sensors by an extra 15 degrees, we would have something similar to the diagram on Figure 7 [2].
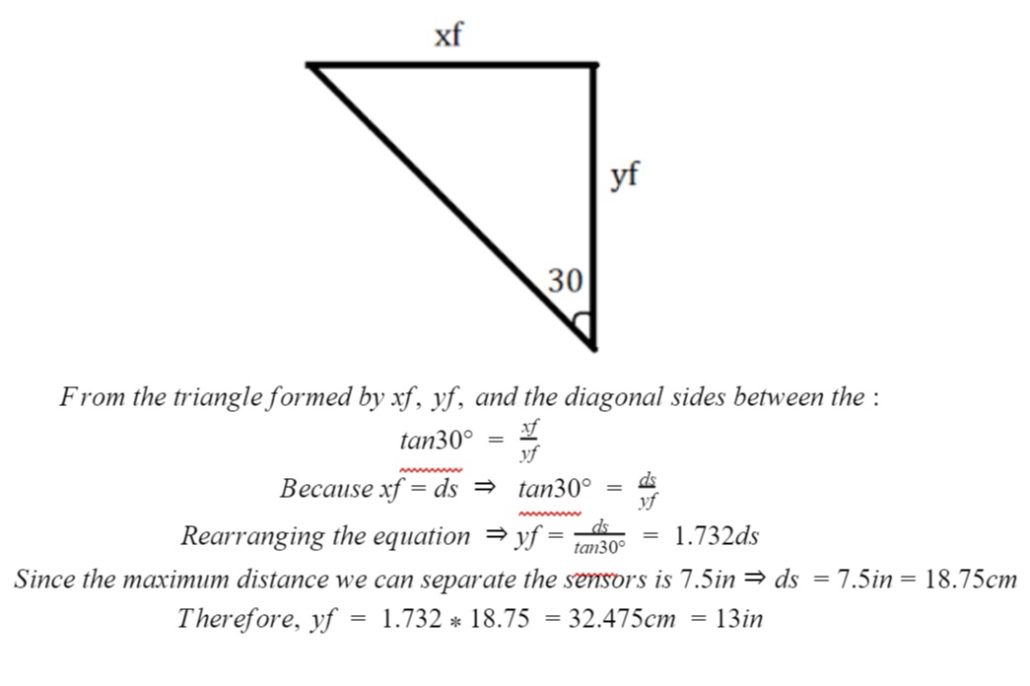
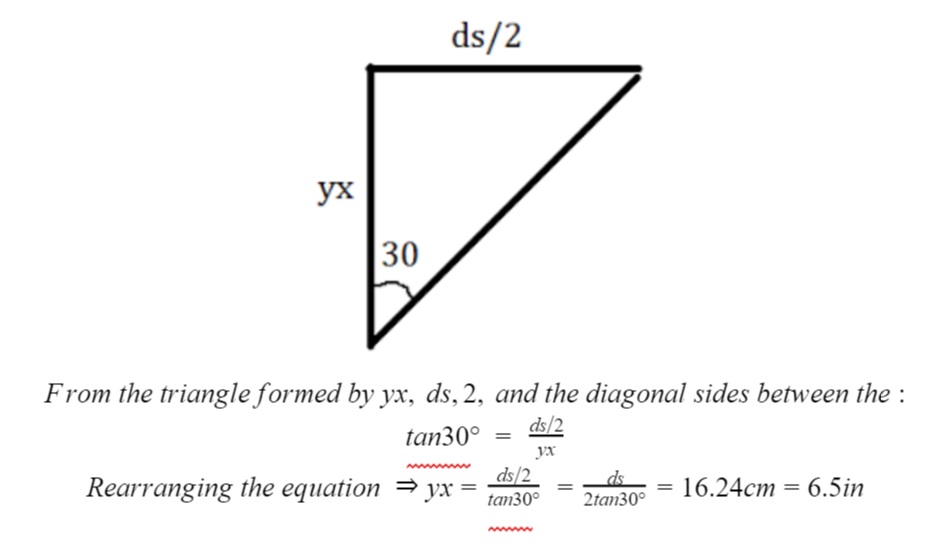
Each sensor is located on the bottom left and right corners and they are angled to the right or left. The variable ds represents the distance between the sensors, yx represents the distance where the sensors cross, yf represents the distance from the sensors where the full coverage is achieved, and xf represents the full coverage across the sensors at the vertical point where there is full coverage. Given the diagram, we can find the lengths of the sides given the distance between the sensors, thus we can find the cross distance yx to determine if we can track BiPed. To find yx shown in Figure 8 and 9:
From the results, we can see that the sensors cross at 6.5 inches and the crossing region maximizes after 13 inches. Therefore, we will be able to track BiPed within the range of 20 inches.
Determining the Number of Unique Horizontal Readings
The number of unique horizontal readings the sensors is able to detect is important because it tells us how many points the sensor will be able to detect as an object moves across the x axis. To calculate this, we first draw a diagram to to show what one sensor is seeing, in our case, the right sensor is drawn in Figure 10.
From the figure, xr represents the horizontal resolution, yr represents the y vertical resolution, and y represents the straight length if the object is placed directly in front of the sensor. To determine the horizontal resolution, we need to find xr to find unique readings shown in Figure 11.
From the calculations, we can see that the number of unique readings the sensor can detect an object moving along the horizontal axis is about 2. In other words, the farther away an object is from the sensor, the less x axis resolution there will be. So in our case, it would be ideal to track BiPed from a closer distance than 20 inches. Figure 12 illustrates the resolution as the object moves across the horizontal axis. The x value represents the distance the object is away from the sensor and the y axis represents the number of unique readings the object is able to detect at the distance the object is away from the sensor. As a result, we can see that the closer an object is to the sensor, the better the sensor is able to detect an object move across the x-axis.
Conclusion
From the different experiments conducted, we determined that the sensors are able to track BiPed from a range of 20 inches. If BiPed can be tracked closer, the sensors will be able to detect better movements. Also, the sensors will have to be angled about 15 degrees to make their 30 degree field of view face each other to provide the best range for tracking. This experiment will be able to move the design forward in helping to develop a more sophisticated control algorithm. Thus, we can be able to follow BiPed autonomously at a fixed range close to 20 inches.


