Goliath Fall 2016
Schedule and Burndown
By: Kristen Oduca (Project Manager)
Introudction
Requirement: Goliath shall be completed by Wednesday, December 14, 2016.
As project manager, we have to generate a schedule and burndown in order to keep track of your group. Tasks need to be delegated accordingly and at understandable rates. I would recommend looking at other groups work breakdown structure and schedule to get a feel of how things are broken down in the schedule. This schedule was created mid semester, and I would highly recommend to making it earlier in order to have more wiggle room and learn to adjust using the schedule to delegate responsibilities. It is harder to do than it sounds.
Project Libre
The schedule was based on the work breakdown structure as shown in Figure 1.
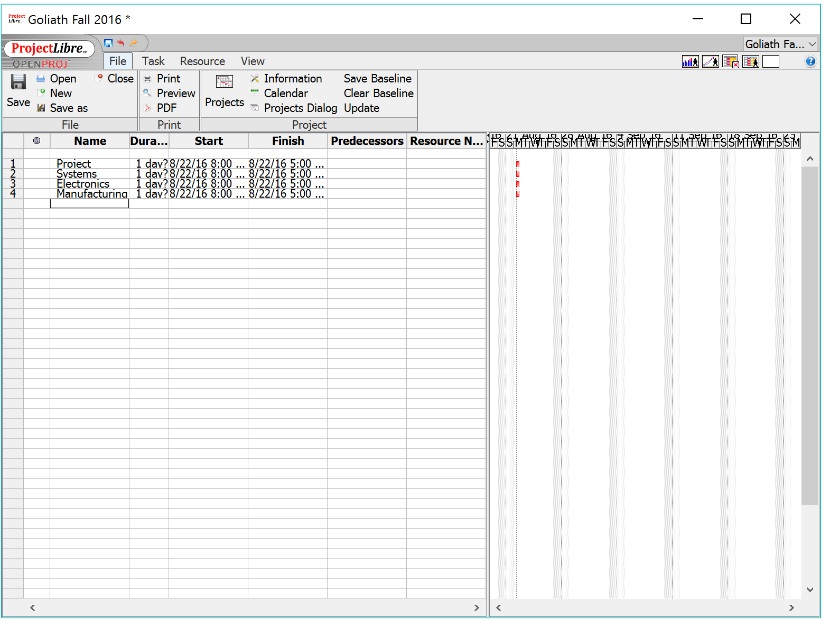
Using the generic schedule provided on Professor’s Hill’s website, I jotted down ideally when each task should be finished and how long it should take [1]. It is ideal to schedule things more in advance and leave some wiggle room just in case anything happens. I used Project Libre in order to create my schedule. I downloaded it the program from the following link [2]. After downloading it and opening the program, the program will display the following in Figure 2.
I created a new project and entered the following data. The start date was set to the first day of class for 400D as shown in Figure 3.
After pressing “OK”, I inputted all the positions into the name column as shown in Figure 4.
Looking at a WBS, I inserted all the titles for each box in the corresponding places. I did this by first inserting a row. In order to do so, I clicked the box where I wanted to enter the new row. In tabs, I clicked “Tasks”. In the “Tasks” box I pressed “Insert”, the button with the green arrow next to it. This is shown in Figure 5.
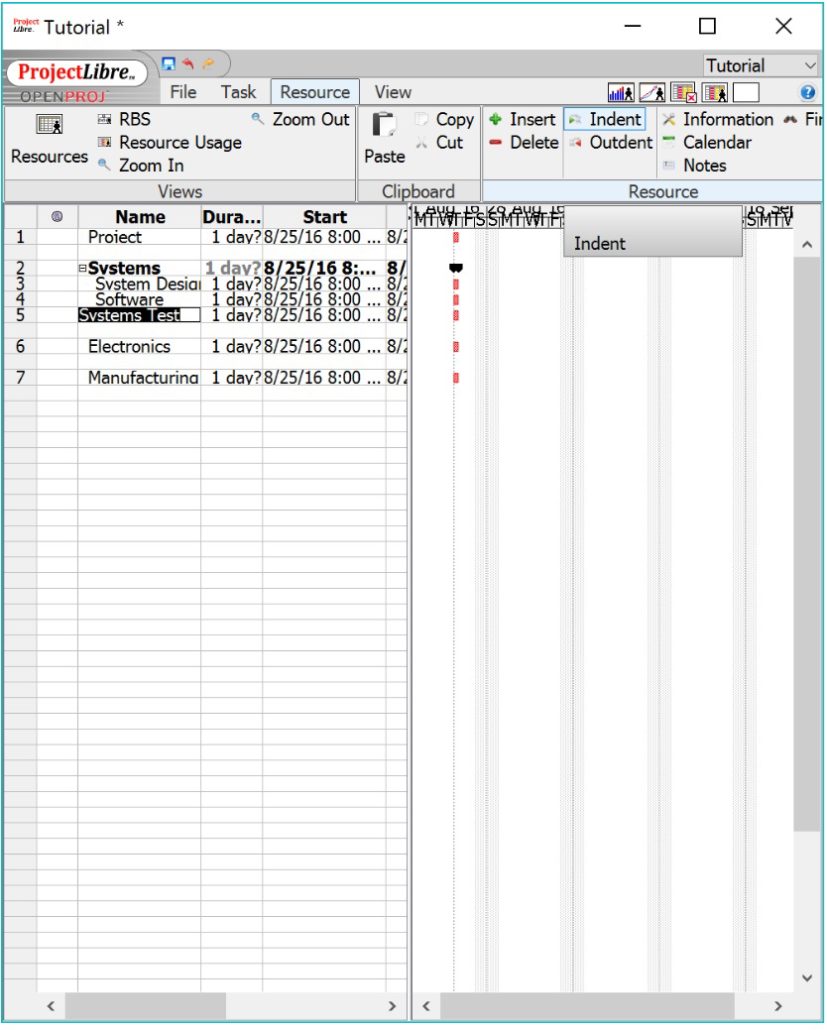
If too many rows were added, press the row to be removed and press the “Delete” button, which is under the “Insert Button”. I inserted the number of rows equivalent to the number or box titles I had for each person and typed in the titles. In order to show that the following title of tasks were for the designated person, I used the indent tool, which can be found in the “Task” tab in the “Task” box next to “Insert” button. This is shown in Figure 6.
Under the generalized title for tasks, I added the number of rows equivalent to the number of tasks in that section. I also indented these tasks as shown in Figure 7.
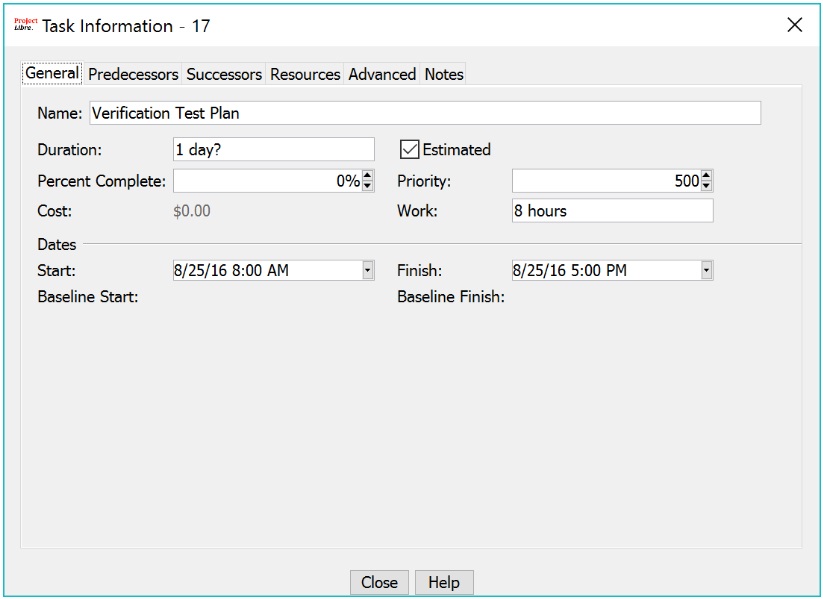
I proceeded to do it this til all tasks are on Project Libre for each member. To set the dates I double clicked the the tasks, which opened a window shown in Figure 8.
I changed the start date and finish date to the proper times. This is done for all tasks. There is no need to do it for the title’s of the tasks since Project Libre does it automatically. Each meeting I had with my group, I asked for the status of their project in order to enter the percent complete, which is in the Task Information as shown in Figure 8 above. In order to show my critical path I used predecessors to show the task that needs to be completed before that task is completed. For example, the PPP line 10 first has to complete the PDD in line 9. The predecessor would be line 9. This is shown in Figure 9.
In order to add names next the tasks. I went to the “Resource” tab and in the “Views” box pressed “Resources”. In the name column, I enter the names of the task or the person completing it. To show our critical path, I only added the task names of the tasks within the critical path. Our schedule can be found in this link. Link to Download Schedule
Burn Down
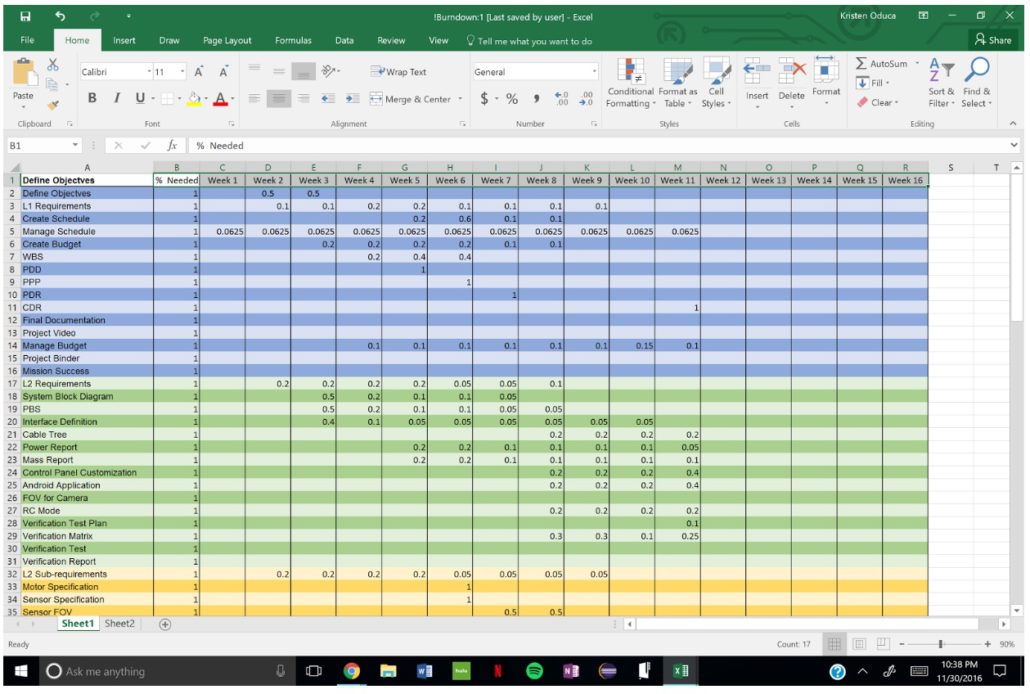
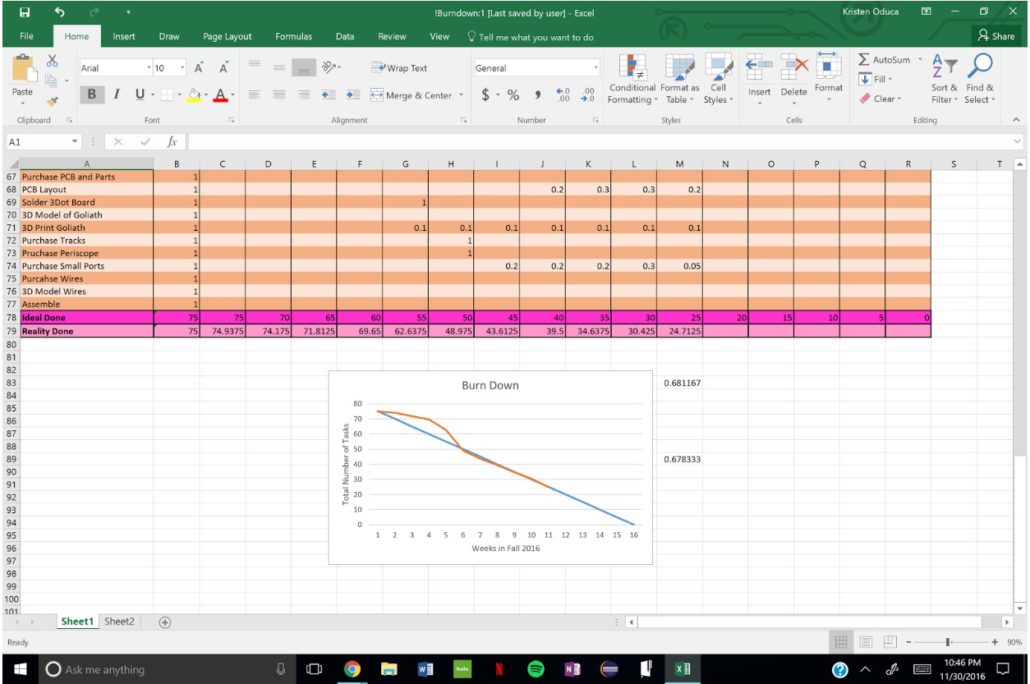
I used Excel to create the burn down. In Column A I entered all the tasks to be completed. In Column B I entered the percent to be completed for each tasks. In Row 1, I put the total amount of weeks we have in the semester. Each week, I documented the percent completed for each task. Figure 10 shows an example.
At the bottom, I made two rows for the total number of tasks, one is ideal and one is reality. In the ideally done row, I took the total number of tasks and decremented it evenly over the span of the total of weeks. For the reality done, I summed up the task percentage for each week. In other words, I summed up each column. I highlighted both rows and graphed them on excel. This can be seen in Figure 11.
Attached is the Excel document I created for Goliath. Link to Download Burndown
Conclusion
When using the schedule and burndown to keep track of tasks, it is important to constantly update it and the status. There have been several times where we thought we were done with a task, but after to talking to Professor Hill, he thought a better way to implement the task that was “complete”. Also, there are times when new features are added to your project. In my opinion, each task duration should be the maximum amount of time you think it would take to complete the task, but scheduled in a way that completes the project a few weeks before it is due to leave room for unpredictable situations.


